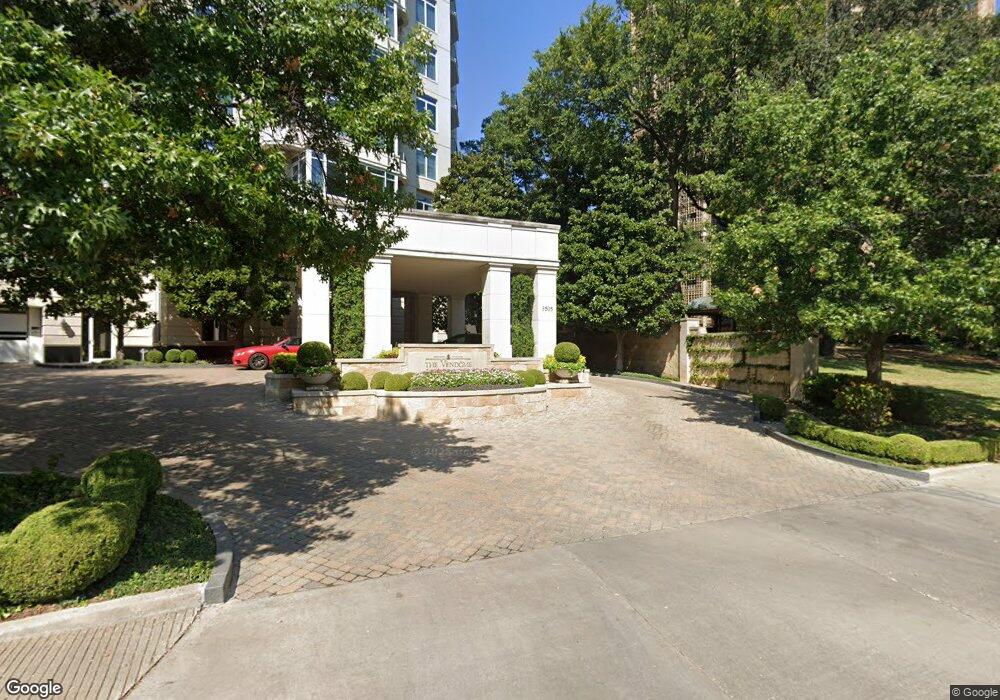
The Vendome on Turtle Creek 3505 Turtle Creek Blvd Unit 20A Dallas, TX 75219
Turtle Creek NeighborhoodEstimated Value: $4,505,000 - $6,121,000
4
Beds
4
Baths
7,086
Sq Ft
$763/Sq Ft
Est. Value
About This Home
This home is located at 3505 Turtle Creek Blvd Unit 20A, Dallas, TX 75219 and is currently estimated at $5,409,797, approximately $763 per square foot. 3505 Turtle Creek Blvd Unit 20A is a home located in Dallas County with nearby schools including Ben Milam Elementary School, Alex W. Spence Talented/Gifted Academy, and North Dallas High School.
Ownership History
Date
Name
Owned For
Owner Type
Purchase Details
Closed on
Aug 16, 2019
Sold by
Warrington Mgt Lp
Bought by
Kimple Scott C and Kimple 2004 Trust
Current Estimated Value
Home Financials for this Owner
Home Financials are based on the most recent Mortgage that was taken out on this home.
Original Mortgage
$4,550,000
Outstanding Balance
$3,959,986
Interest Rate
3.4%
Mortgage Type
Adjustable Rate Mortgage/ARM
Estimated Equity
$1,449,811
Purchase Details
Closed on
Mar 18, 2010
Sold by
Kimple Scott C
Bought by
Warrington Mgt Lp
Purchase Details
Closed on
May 24, 2006
Sold by
Vendome Partners Lp
Bought by
Kimple Scott C
Home Financials for this Owner
Home Financials are based on the most recent Mortgage that was taken out on this home.
Original Mortgage
$1,500,000
Interest Rate
5.25%
Mortgage Type
Fannie Mae Freddie Mac
Create a Home Valuation Report for This Property
The Home Valuation Report is an in-depth analysis detailing your home's value as well as a comparison with similar homes in the area
Home Values in the Area
Average Home Value in this Area
Purchase History
| Date | Buyer | Sale Price | Title Company |
|---|---|---|---|
| Kimple Scott C | -- | Ctot | |
| Warrington Mgt Lp | -- | None Available | |
| Kimple Scott C | -- | Capital Title |
Source: Public Records
Mortgage History
| Date | Status | Borrower | Loan Amount |
|---|---|---|---|
| Open | Kimple Scott C | $4,550,000 | |
| Previous Owner | Kimple Scott C | $1,500,000 |
Source: Public Records
Tax History Compared to Growth
Tax History
| Year | Tax Paid | Tax Assessment Tax Assessment Total Assessment is a certain percentage of the fair market value that is determined by local assessors to be the total taxable value of land and additions on the property. | Land | Improvement |
|---|---|---|---|---|
| 2025 | $99,714 | $5,330,000 | $249,400 | $5,080,600 |
| 2024 | $99,714 | $5,600,000 | $249,400 | $5,350,600 |
| 2023 | $99,714 | $4,850,000 | $230,930 | $4,619,070 |
| 2022 | $100,015 | $4,000,000 | $230,930 | $3,769,070 |
| 2021 | $105,520 | $4,000,000 | $230,930 | $3,769,070 |
| 2020 | $108,515 | $5,181,640 | $0 | $0 |
| 2019 | $100,806 | $3,543,000 | $230,930 | $3,312,070 |
| 2018 | $100,611 | $3,700,000 | $230,930 | $3,469,070 |
| 2017 | $81,578 | $3,000,000 | $138,560 | $2,861,440 |
| 2016 | $81,579 | $3,000,000 | $138,560 | $2,861,440 |
| 2015 | $64,624 | $2,356,000 | $92,370 | $2,263,630 |
| 2014 | $64,624 | $2,356,000 | $92,370 | $2,263,630 |
Source: Public Records
About The Vendome on Turtle Creek
Map
Nearby Homes
- 3505 Turtle Creek Blvd Unit 5A
- 3505 Turtle Creek Blvd Unit 2F
- 3505 Turtle Creek Blvd Unit 17E
- 3505 Turtle Creek Blvd Unit 3B
- 3505 Turtle Creek Blvd Unit 4C
- 3505 Turtle Creek Blvd Unit 2A
- 3505 Turtle Creek Blvd Unit 12F
- 3505 Turtle Creek Blvd Unit 18C
- 3525 Turtle Creek Blvd Unit 6D
- 3525 Turtle Creek Blvd Unit 4E
- 3525 Turtle Creek Blvd Unit 3D
- 3525 Turtle Creek Blvd Unit 22A
- 3401 Lee Pkwy Unit 502
- 3401 Lee Pkwy Unit 605
- 3401 Lee Pkwy Unit 505
- 3400 Welborn St Unit 306
- 3400 Welborn St Unit 226
- 3601 Turtle Creek Blvd Unit T3
- 3601 Turtle Creek Blvd Unit 802
- 3621 Turtle Creek Blvd Unit 9K
- 3505 Turtle Creek Blvd Unit 18F
- 3505 Turtle Creek Blvd Unit 5D
- 3505 Turtle Creek Blvd Unit 11G
- 3505 Turtle Creek Blvd Unit 7B
- 3505 Turtle Creek Blvd Unit 16G
- 3505 Turtle Creek Blvd Unit 5F
- 3505 Turtle Creek Blvd Unit 11F
- 3505 Turtle Creek Blvd Unit 16F
- 3505 Turtle Creek Blvd Unit 15C
- 3505 Turtle Creek Blvd Unit 15F
- 3505 Turtle Creek Blvd Unit 11D
- 3505 Turtle Creek Blvd Unit 18D
- 3505 Turtle Creek Blvd Unit 3E
- 3505 Turtle Creek Blvd Unit 8D
- 3505 Turtle Creek Blvd Unit 6G
- 3505 Turtle Creek Blvd Unit 14F
- 3505 Turtle Creek Blvd Unit 4F
- 3505 Turtle Creek Blvd Unit 11E
- 3505 Turtle Creek Blvd Unit 4A
- 3505 Turtle Creek Blvd Unit 9E