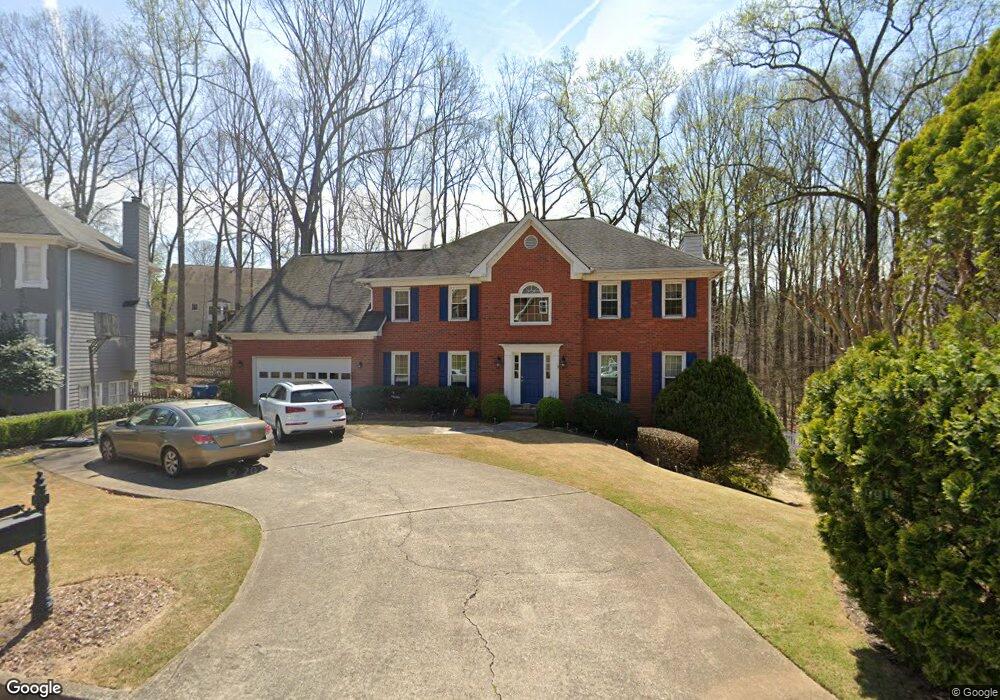
3505 Waters Glen Way Alpharetta, GA 30022
Estimated Value: $658,000 - $755,497
4
Beds
4
Baths
2,968
Sq Ft
$241/Sq Ft
Est. Value
About This Home
This home is located at 3505 Waters Glen Way, Alpharetta, GA 30022 and is currently estimated at $714,374, approximately $240 per square foot. 3505 Waters Glen Way is a home located in Fulton County with nearby schools including Dolvin Elementary School, Autrey Mill Middle School, and Johns Creek High School.
Ownership History
Date
Name
Owned For
Owner Type
Purchase Details
Closed on
Sep 26, 2014
Sold by
Denise
Bought by
Myers Denise
Current Estimated Value
Home Financials for this Owner
Home Financials are based on the most recent Mortgage that was taken out on this home.
Original Mortgage
$152,000
Outstanding Balance
$113,092
Interest Rate
3.32%
Mortgage Type
New Conventional
Estimated Equity
$601,282
Purchase Details
Closed on
Jun 30, 2000
Sold by
Harris Stanley J and Harris Carole N
Bought by
Myers Denise M and Myers Vincent A
Home Financials for this Owner
Home Financials are based on the most recent Mortgage that was taken out on this home.
Original Mortgage
$197,600
Interest Rate
8.54%
Mortgage Type
New Conventional
Purchase Details
Closed on
Oct 26, 1995
Sold by
Croxton Michael Pamela
Bought by
Harris Stanley J Carole
Create a Home Valuation Report for This Property
The Home Valuation Report is an in-depth analysis detailing your home's value as well as a comparison with similar homes in the area
Home Values in the Area
Average Home Value in this Area
Purchase History
| Date | Buyer | Sale Price | Title Company |
|---|---|---|---|
| Myers Denise | -- | -- | |
| Myers Denise M | $247,000 | -- | |
| Harris Stanley J Carole | $205,500 | -- |
Source: Public Records
Mortgage History
| Date | Status | Borrower | Loan Amount |
|---|---|---|---|
| Open | Myers Denise | $152,000 | |
| Previous Owner | Myers Denise M | $197,600 | |
| Closed | Harris Stanley J Carole | $0 |
Source: Public Records
Tax History Compared to Growth
Tax History
| Year | Tax Paid | Tax Assessment Tax Assessment Total Assessment is a certain percentage of the fair market value that is determined by local assessors to be the total taxable value of land and additions on the property. | Land | Improvement |
|---|---|---|---|---|
| 2025 | $709 | $325,440 | $57,040 | $268,400 |
| 2023 | $709 | $276,120 | $61,200 | $214,920 |
| 2022 | $3,367 | $179,920 | $40,320 | $139,600 |
| 2021 | $3,936 | $174,720 | $39,160 | $135,560 |
| 2020 | $3,951 | $164,720 | $43,200 | $121,520 |
| 2019 | $582 | $161,800 | $42,440 | $119,360 |
| 2018 | $3,841 | $158,000 | $41,440 | $116,560 |
| 2017 | $3,278 | $124,280 | $33,520 | $90,760 |
| 2016 | $3,074 | $124,280 | $33,520 | $90,760 |
| 2015 | $3,047 | $102,680 | $33,520 | $69,160 |
| 2014 | $2,165 | $83,360 | $17,520 | $65,840 |
Source: Public Records
Map
Nearby Homes
- 235 Wood Shoals Ct
- 415 Wood Trace Ct
- 3430 Waters Mill Dr
- 9925 Lauren Hall Ct
- 825 Highland Bend Cove
- 120 Thome Dr
- 10050 Lauren Hall Ct
- 3335 Waters Mill Dr
- 610 Varina Way
- 3396 Carverton Ln
- 125 Sandridge Ct
- 10845 Carrissa Trail
- 3273 Long Indian Creek Ct
- 10000 Barston Ct
- 300 Olmstead Way
- 201 Downing Dr Unit 76
- 465 Kirkstall Trail
- 710 Country Manor Way
- 125 Oak Bridge Ct Unit 2
- 3495 Waters Glen Way
- 3515 Waters Glen Way
- 3530 Waters Cove Way
- 3540 Waters Cove Way
- 3485 Waters Glen Way
- 3520 Waters Cove Way
- 3550 Waters Cove Way
- 3525 Waters Glen Way
- 3465 Waters Glen Way
- 3540 Waters Glen Way
- 3455 Waters Glen Way
- 3550 Waters Glen Way
- 3510 Waters Cove Way
- 3475 Waters Glen Way
- 3560 Waters Cove Way
- 3530 Waters Glen Way
- 0 Waters Cove Way Unit 7186449
- 0 Waters Cove Way Unit 8086327
- 0 Waters Cove Way Unit 8593091
- 0 Waters Cove Way Unit 3203741