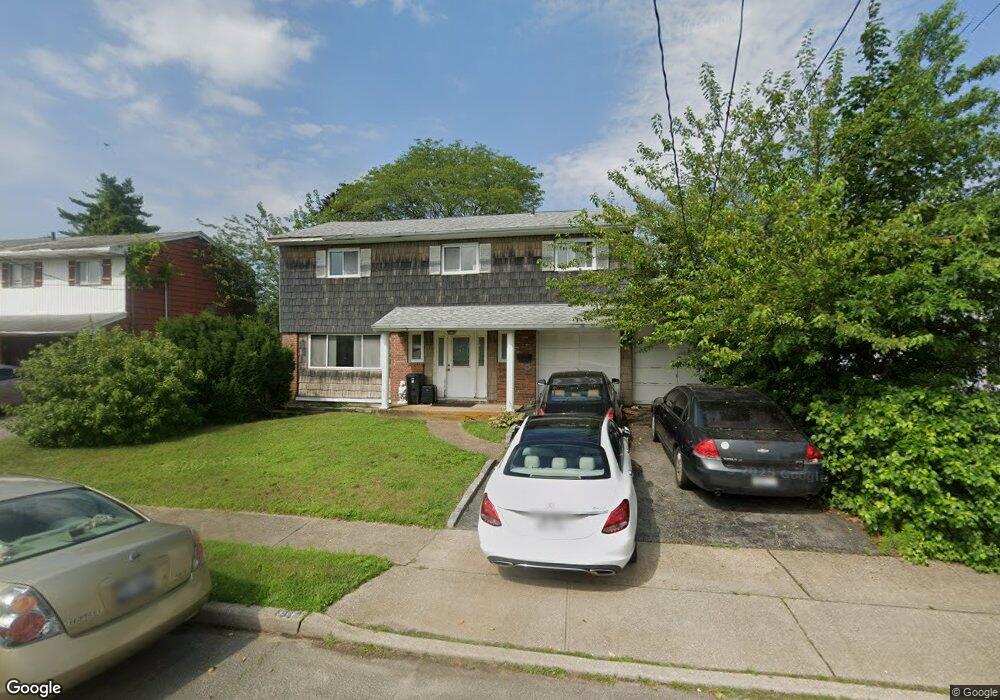
3506 Daniel Crescent Baldwin, NY 11510
Estimated Value: $713,000 - $930,000
4
Beds
3
Baths
2,185
Sq Ft
$382/Sq Ft
Est. Value
About This Home
This home is located at 3506 Daniel Crescent, Baldwin, NY 11510 and is currently estimated at $834,698, approximately $382 per square foot. 3506 Daniel Crescent is a home located in Nassau County with nearby schools including Baldwin Senior High School.
Ownership History
Date
Name
Owned For
Owner Type
Purchase Details
Closed on
Jul 2, 2025
Sold by
Lemke Corp
Bought by
Lemke Pamela
Current Estimated Value
Purchase Details
Closed on
Jul 19, 2024
Sold by
Lemke Pamela
Bought by
Lemke Corp
Home Financials for this Owner
Home Financials are based on the most recent Mortgage that was taken out on this home.
Original Mortgage
$325,000
Outstanding Balance
$319,834
Interest Rate
6.87%
Mortgage Type
Construction
Estimated Equity
$514,864
Purchase Details
Closed on
Sep 2, 2014
Sold by
The Rose Rogg Revocable Trust and Rogg
Bought by
Lemke Pamela
Purchase Details
Closed on
May 28, 2010
Sold by
Rogg Rose
Bought by
Rogg Rose
Create a Home Valuation Report for This Property
The Home Valuation Report is an in-depth analysis detailing your home's value as well as a comparison with similar homes in the area
Home Values in the Area
Average Home Value in this Area
Purchase History
| Date | Buyer | Sale Price | Title Company |
|---|---|---|---|
| Lemke Pamela | -- | Abstracts Incorporated | |
| Lemke Corp | -- | Chicago Title Insurance Co | |
| Lemke Corp | -- | Chicago Title Insurance Co | |
| Lemke Corp | -- | Chicago Title Insurance Co | |
| Lemke Corp | -- | Chicago Title Insurance Co | |
| Lemke Pamela | $310,000 | -- | |
| Lemke Pamela | $310,000 | -- | |
| Lemke Pamela | $310,000 | -- | |
| Rogg Rose | -- | -- | |
| Rogg Rose | -- | -- | |
| Rogg Rose | -- | -- |
Source: Public Records
Mortgage History
| Date | Status | Borrower | Loan Amount |
|---|---|---|---|
| Open | Lemke Corp | $325,000 | |
| Closed | Lemke Corp | $325,000 | |
| Closed | Lemke Pamela | $0 |
Source: Public Records
Tax History
| Year | Tax Paid | Tax Assessment Tax Assessment Total Assessment is a certain percentage of the fair market value that is determined by local assessors to be the total taxable value of land and additions on the property. | Land | Improvement |
|---|---|---|---|---|
| 2025 | $14,581 | $508 | $208 | $300 |
| 2024 | $3,899 | $508 | $208 | $300 |
| 2023 | $12,460 | $503 | $206 | $297 |
| 2022 | $12,460 | $508 | $208 | $300 |
| 2021 | $16,438 | $488 | $200 | $288 |
| 2020 | $14,821 | $614 | $544 | $70 |
| 2019 | $10,471 | $658 | $420 | $238 |
| 2018 | $10,625 | $914 | $0 | $0 |
| 2017 | $9,504 | $914 | $583 | $331 |
| 2016 | $13,908 | $914 | $583 | $331 |
| 2015 | $3,180 | $914 | $583 | $331 |
| 2014 | $3,180 | $914 | $583 | $331 |
| 2013 | $2,975 | $914 | $583 | $331 |
Source: Public Records
Map
Nearby Homes
- 3526 Daniel Crescent
- 3486 Howard Blvd
- 3476 Colony Dr
- 3442 Colony Dr
- 3434 Colony Dr
- 3427 Carey Ln
- 3429 Courtney Place
- 3505 Bay Front Dr
- 974 Mildred Dr
- 3641 Bertha Dr
- 3471 Bay Front Dr
- 3600 Bertha Dr
- 3433 Bay Front Place
- 957 Cherrywood Dr
- 3322 Parkway Dr
- 957 Jerome St
- 3263 Milburn Ave
- 3291 Wolfson Dr
- 1061 Northern Blvd
- 3249 Wolfson Dr
- 3500 Daniel Crescent
- 3512 Daniel Crescent
- 3505 Milburn Ave
- 3511 Milburn Ave
- 3494 Daniel Crescent
- 3499 Milburn Ave
- 3518 Daniel Crescent
- 3503 Daniel Crescent
- 3509 Daniel Crescent
- 3493 Milburn Ave
- 3515 Daniel Crescent
- 3491 Daniel Crescent
- 3488 Daniel Crescent
- 3487 Milburn Ave
- 3521 Daniel Crescent
- 3525 Milburn Ave
- 3479 Milburn Ave
- 3487 Daniel Crescent
- 3525 Daniel Crescent
- 3536 Daniel Crescent
Your Personal Tour Guide
Ask me questions while you tour the home.