Estimated Value: $460,723 - $740,000
4
Beds
3
Baths
3,666
Sq Ft
$149/Sq Ft
Est. Value
About This Home
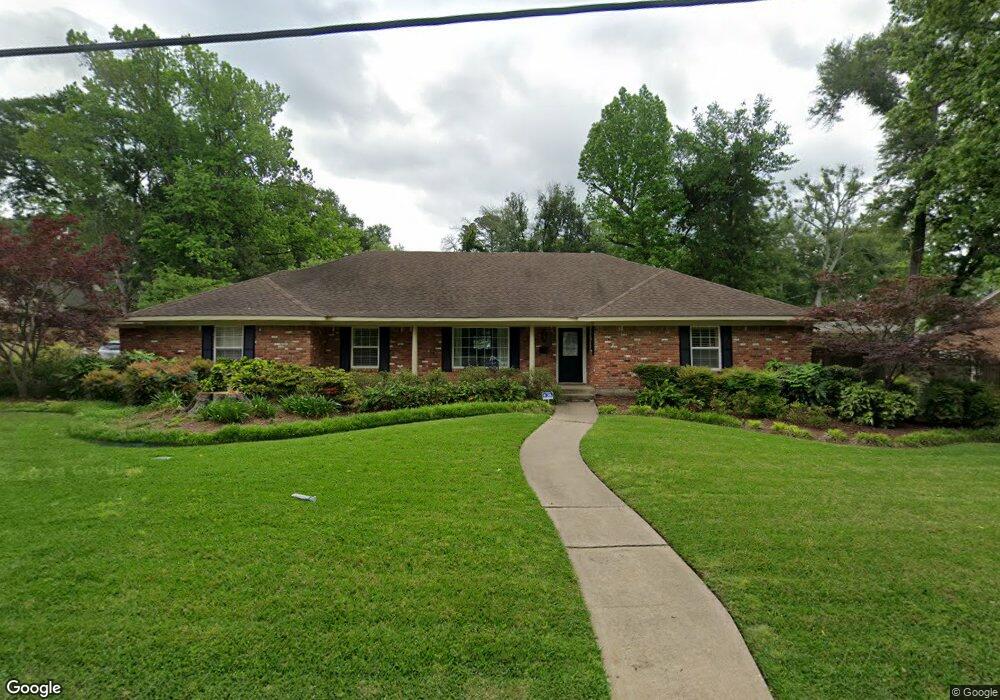
This home is located at 3506 Fry Ave, Tyler, TX 75701 and is currently estimated at $544,431, approximately $148 per square foot. 3506 Fry Ave is a home located in Smith County with nearby schools including Woods Elementary School, Hubbard Middle School, and Tyler Legacy High School.
Ownership History
Date
Name
Owned For
Owner Type
Purchase Details
Closed on
Oct 9, 2023
Sold by
Pongetti Philip C and Pongetti Audrey J
Bought by
Pongetti Living Trust and Pongetti
Current Estimated Value
Purchase Details
Closed on
Oct 20, 2021
Sold by
Cargo Charles F and Cargo Barbara J
Bought by
Pongetti Philip C and Pongetti Audrey J
Purchase Details
Closed on
Mar 14, 2016
Sold by
Glenney John C and Glenney Shannon L
Bought by
Pongetti Philip C and Pongetti Audrey J
Purchase Details
Closed on
Aug 15, 2012
Sold by
Osborn John Charles and Osborn Linda Marie
Bought by
Glenney John C and Glenney Shannon L
Home Financials for this Owner
Home Financials are based on the most recent Mortgage that was taken out on this home.
Original Mortgage
$250,000
Interest Rate
3.63%
Mortgage Type
New Conventional
Purchase Details
Closed on
Jun 16, 2005
Sold by
Osborn John Charles and Osborn Linda Marie
Bought by
Osborn John Charles and Osborn Linda Marie
Create a Home Valuation Report for This Property
The Home Valuation Report is an in-depth analysis detailing your home's value as well as a comparison with similar homes in the area
Home Values in the Area
Average Home Value in this Area
Purchase History
| Date | Buyer | Sale Price | Title Company |
|---|---|---|---|
| Pongetti Living Trust | -- | -- | |
| Pongetti Philip C | -- | None Available | |
| Pongetti Philip C | -- | Ctc | |
| Glenney John C | -- | Ctc | |
| Osborn John Charles | -- | None Available |
Source: Public Records
Mortgage History
| Date | Status | Borrower | Loan Amount |
|---|---|---|---|
| Previous Owner | Glenney John C | $250,000 |
Source: Public Records
Tax History Compared to Growth
Tax History
| Year | Tax Paid | Tax Assessment Tax Assessment Total Assessment is a certain percentage of the fair market value that is determined by local assessors to be the total taxable value of land and additions on the property. | Land | Improvement |
|---|---|---|---|---|
| 2025 | $4,945 | $370,709 | $50,342 | $320,367 |
| 2024 | $4,945 | $405,000 | $56,327 | $348,673 |
| 2023 | $6,846 | $427,372 | $56,327 | $371,045 |
| 2022 | $6,994 | $393,443 | $49,192 | $344,251 |
| 2021 | $6,809 | $324,558 | $49,192 | $275,366 |
| 2020 | $6,821 | $318,782 | $49,192 | $269,590 |
| 2019 | $6,432 | $294,142 | $49,192 | $244,950 |
| 2018 | $5,889 | $270,788 | $37,551 | $233,237 |
| 2017 | $5,781 | $270,788 | $37,551 | $233,237 |
| 2016 | $5,817 | $272,473 | $37,551 | $234,922 |
| 2015 | $5,126 | $261,101 | $37,551 | $223,550 |
| 2014 | $5,126 | $253,560 | $37,551 | $216,009 |
Source: Public Records
Map
Nearby Homes
- 3511 S Keaton Ave
- 1113 E Amherst Dr
- 3523 S Cameron Ave
- 3710 Bain Place
- 1018 Pollard Dr
- 1408 Westfield St
- 3712 Colony Park Dr
- 1101 Clyde Dr
- 3235 Curtis Dr
- 1505 Glenrose St
- 3215 Curtis Dr
- 1024 Clyde Dr
- 3006 de Charles St
- 3400 Birdwell Dr
- 4021 New Copeland Rd
- 3210 S Donnybrook Ave
- 3202 S Donnybrook Ave
- 905 E Watkins St
- 3110 Curtis Dr
- 1107 Pinedale Place