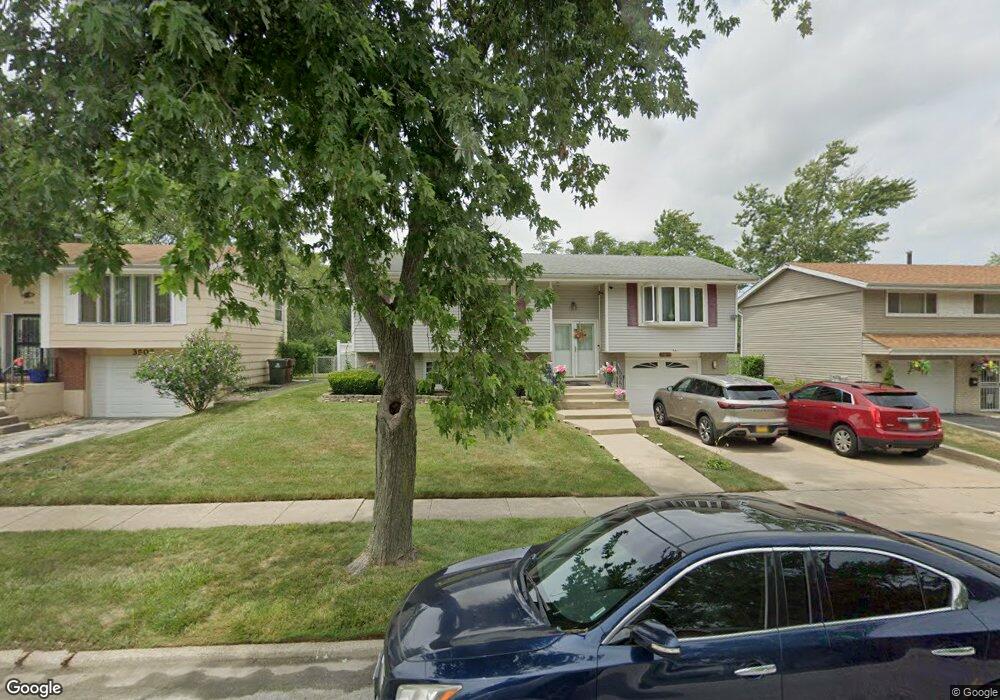
3506 Laurel Ln Hazel Crest, IL 60429
Estimated Value: $220,000 - $267,000
4
Beds
2
Baths
1,734
Sq Ft
$136/Sq Ft
Est. Value
About This Home
This home is located at 3506 Laurel Ln, Hazel Crest, IL 60429 and is currently estimated at $235,951, approximately $136 per square foot. 3506 Laurel Ln is a home located in Cook County with nearby schools including Highlands Elementary School, Prairie-Hills Junior High School, and Hillcrest High School.
Ownership History
Date
Name
Owned For
Owner Type
Purchase Details
Closed on
Jun 29, 1999
Sold by
Hud
Bought by
Smith Jerome and Smith Debra
Current Estimated Value
Purchase Details
Closed on
Jul 31, 1995
Sold by
Equitable Real Estate Investments Inc
Bought by
Smith Jerome and Smith Debra A
Home Financials for this Owner
Home Financials are based on the most recent Mortgage that was taken out on this home.
Original Mortgage
$86,759
Interest Rate
7.56%
Mortgage Type
FHA
Purchase Details
Closed on
Jan 3, 1995
Sold by
Wesley Jeffery and Wesley Beverlt
Bought by
Newport Funding Co
Purchase Details
Closed on
Oct 14, 1994
Sold by
Hud
Bought by
Wesley Jeffery and Wesley Beverly S
Purchase Details
Closed on
Sep 27, 1994
Sold by
Wesley Jeffrey and Wesley Beverly S
Bought by
Hud
Purchase Details
Closed on
Mar 6, 1994
Sold by
Newport Funding Co
Bought by
Equitable Real Estate Investments
Create a Home Valuation Report for This Property
The Home Valuation Report is an in-depth analysis detailing your home's value as well as a comparison with similar homes in the area
Home Values in the Area
Average Home Value in this Area
Purchase History
| Date | Buyer | Sale Price | Title Company |
|---|---|---|---|
| Smith Jerome | -- | -- | |
| Smith Jerome | -- | -- | |
| Newport Funding Co | -- | -- | |
| Newport Funding Co | -- | -- | |
| Wesley Jeffery | -- | -- | |
| Hud | -- | Attorneys Title Guaranty Fun | |
| Equitable Real Estate Investments | -- | -- |
Source: Public Records
Mortgage History
| Date | Status | Borrower | Loan Amount |
|---|---|---|---|
| Previous Owner | Smith Jerome | $86,759 |
Source: Public Records
Tax History Compared to Growth
Tax History
| Year | Tax Paid | Tax Assessment Tax Assessment Total Assessment is a certain percentage of the fair market value that is determined by local assessors to be the total taxable value of land and additions on the property. | Land | Improvement |
|---|---|---|---|---|
| 2024 | $7,010 | $17,000 | $2,535 | $14,465 |
| 2023 | $4,427 | $17,000 | $2,535 | $14,465 |
| 2022 | $4,427 | $9,451 | $2,145 | $7,306 |
| 2021 | $4,331 | $9,451 | $2,145 | $7,306 |
| 2020 | $4,265 | $9,451 | $2,145 | $7,306 |
| 2019 | $4,270 | $9,807 | $1,950 | $7,857 |
| 2018 | $4,134 | $9,807 | $1,950 | $7,857 |
| 2017 | $3,899 | $9,807 | $1,950 | $7,857 |
| 2016 | $3,996 | $9,332 | $1,755 | $7,577 |
| 2015 | $3,757 | $9,332 | $1,755 | $7,577 |
| 2014 | $3,695 | $9,332 | $1,755 | $7,577 |
| 2013 | $3,363 | $9,652 | $1,755 | $7,897 |
Source: Public Records
Map
Nearby Homes
- 3500 Maple Ln
- 17113 Elm Dr
- 17206 Elm Dr
- 3324 Laurel Ln
- 17004 Locust Dr
- 3312 Maple Ln
- 3317 Woodworth Place
- 17007 Elm Dr
- 3512 Woodworth Place
- 3509 Birchwood Dr
- 3425 Birchwood Dr
- 3205 Oak Ct
- 3316 Birchwood Dr
- 3618 Peach Grove Ln
- 17316 Central Park Ave
- 17306 Burr Oak Ln
- 3213 Woodworth Place
- 3214 Birchwood Dr
- 17311 Burr Oak Ln
- 3800 171st St
- 3508 Laurel Ln
- 3504 Laurel Ln
- 3510 Laurel Ln
- 3502 Laurel Ln
- 3512 Laurel Ln
- 3512 Laurel Ln
- 3500 Laurel Ln
- 3507 Laurel Ln
- 3505 Laurel Ln
- 3509 Laurel Ln
- 3503 Laurel Ln
- 3511 Laurel Ln
- 3514 Laurel Ln
- 3501 Laurel Ln
- 3513 Laurel Ln
- 17113 Locust Dr
- 17109 Locust Dr
- 17115 Locust Dr
- 3423 Laurel Ln
- 3428 Maple Ln