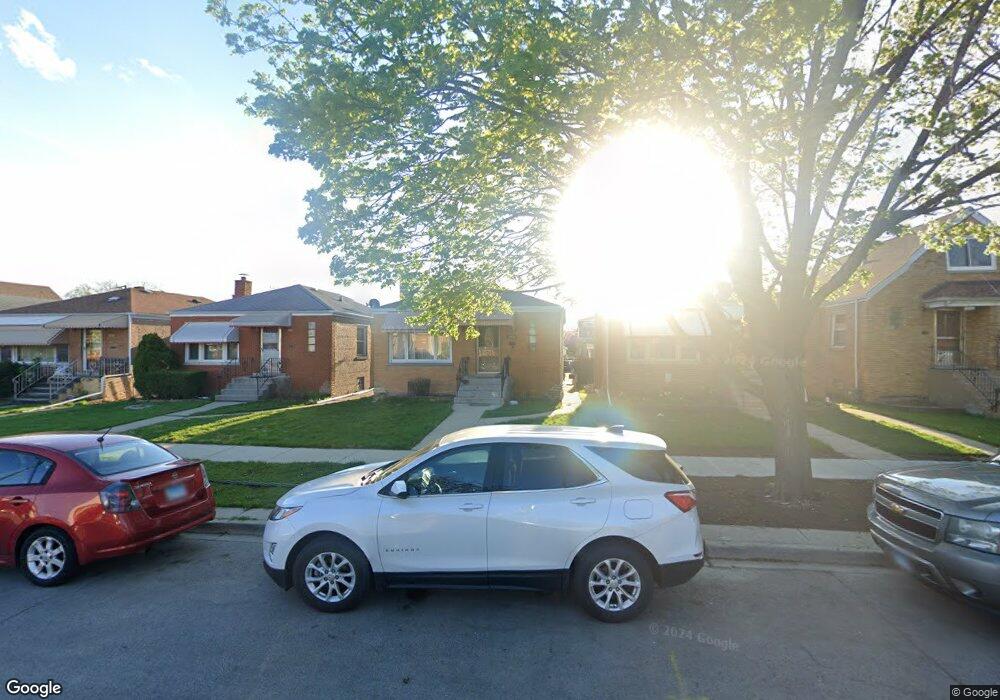
3506 S 54th Ct Cicero, IL 60804
Estimated Value: $226,000 - $295,000
2
Beds
1
Bath
912
Sq Ft
$288/Sq Ft
Est. Value
About This Home
This home is located at 3506 S 54th Ct, Cicero, IL 60804 and is currently estimated at $262,494, approximately $287 per square foot. 3506 S 54th Ct is a home located in Cook County with nearby schools including Drexel Elementary School, Unity Jr High School, and J Sterling Morton Freshman Center.
Ownership History
Date
Name
Owned For
Owner Type
Purchase Details
Closed on
Dec 7, 2009
Sold by
Fannie Mae
Bought by
Zamora Martha
Current Estimated Value
Purchase Details
Closed on
Oct 20, 2009
Sold by
Perales Maria I
Bought by
Federal National Mortgage Association
Purchase Details
Closed on
Dec 22, 2004
Sold by
Rivas Gloria
Bought by
Galindo Julio and Galindo Alma
Home Financials for this Owner
Home Financials are based on the most recent Mortgage that was taken out on this home.
Original Mortgage
$127,020
Interest Rate
5.79%
Mortgage Type
Stand Alone First
Purchase Details
Closed on
Aug 28, 2003
Sold by
Lyden Joyce and Scramuzzo Madeline
Bought by
Rivas Gloria
Home Financials for this Owner
Home Financials are based on the most recent Mortgage that was taken out on this home.
Original Mortgage
$137,837
Interest Rate
6.01%
Mortgage Type
FHA
Create a Home Valuation Report for This Property
The Home Valuation Report is an in-depth analysis detailing your home's value as well as a comparison with similar homes in the area
Home Values in the Area
Average Home Value in this Area
Purchase History
| Date | Buyer | Sale Price | Title Company |
|---|---|---|---|
| Zamora Martha | $70,000 | Attorneys Title Guaranty Fun | |
| Federal National Mortgage Association | -- | None Available | |
| Galindo Julio | $174,000 | All American Escrow & Title | |
| Rivas Gloria | $140,000 | Premier Title |
Source: Public Records
Mortgage History
| Date | Status | Borrower | Loan Amount |
|---|---|---|---|
| Previous Owner | Galindo Julio | $127,020 | |
| Previous Owner | Rivas Gloria | $137,837 |
Source: Public Records
Tax History Compared to Growth
Tax History
| Year | Tax Paid | Tax Assessment Tax Assessment Total Assessment is a certain percentage of the fair market value that is determined by local assessors to be the total taxable value of land and additions on the property. | Land | Improvement |
|---|---|---|---|---|
| 2024 | $5,306 | $19,000 | $4,096 | $14,904 |
| 2023 | $5,789 | $19,000 | $4,096 | $14,904 |
| 2022 | $5,789 | $16,676 | $3,524 | $13,152 |
| 2021 | $5,760 | $16,675 | $3,524 | $13,151 |
| 2020 | $5,696 | $16,675 | $3,524 | $13,151 |
| 2019 | $3,009 | $9,506 | $3,238 | $6,268 |
| 2018 | $2,927 | $9,506 | $3,238 | $6,268 |
| 2017 | $2,849 | $9,506 | $3,238 | $6,268 |
| 2016 | $2,821 | $8,294 | $2,667 | $5,627 |
| 2015 | $2,727 | $8,294 | $2,667 | $5,627 |
| 2014 | $2,650 | $8,294 | $2,667 | $5,627 |
| 2013 | $3,171 | $10,215 | $2,667 | $7,548 |
Source: Public Records
Map
Nearby Homes
- 3529 S 54th Ave
- 3606 S 53rd Ct
- 3524 S Central Ave
- 3631 S 55th Ct
- 3631 S 54th Ave
- 3413 S 56th Ct
- 3628 54th Ct
- 3632 S 52nd Ct
- 3539 S 57th Ct
- 3215 S 54th Ct
- 3633 S 57th Ct
- 3733 S 57th Ave
- 3141 S 54th Ct
- 3426 S 58th Ave
- 3307 S 58th Ave
- 3131 S 54th Ave
- 3314 S 58th Ave
- 3116 S 55th Ave
- 3820 S 57th Ave
- 5126 W 32nd St
- 3508 S 54th Ct
- 3504 S 54th Ct
- 3510 S 54th Ct
- 3502 S 54th Ct
- 3512 S 54th Ct
- 3500 S 54th Ct
- 3514 S 54th Ct
- 3507 S 55th Ave
- 3505 S 55th Ave
- 3509 S 55th Ave
- 3516 S 54th Ct
- 3511 S 55th Ave
- 3503 S 55th Ave
- 3513 S 55th Ave
- 3518 S 54th Ct
- 3515 S 55th Ave
- 3507 S 54th Ct
- 3509 S 54th Ct
- 3505 S 54th Ct
- 3511 S 54th Ct