3506 White Willow Cir Champaign, IL 61822
Estimated Value: $270,000 - $365,000
Studio
--
Bath
--
Sq Ft
12,589
Sq Ft Lot
About This Home
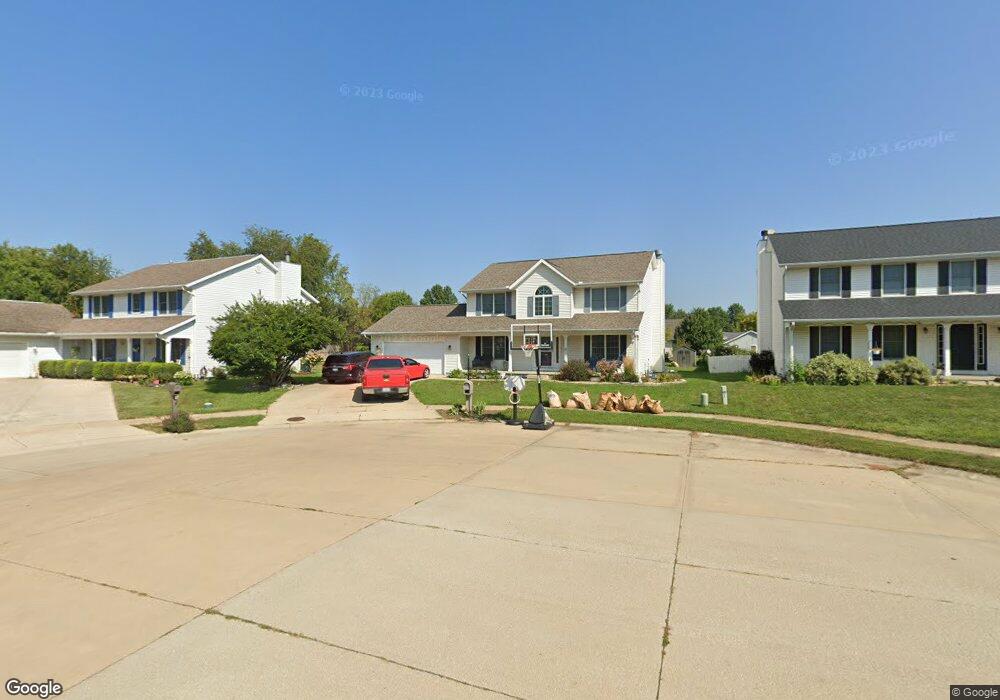
This home is located at 3506 White Willow Cir, Champaign, IL 61822 and is currently estimated at $315,291. 3506 White Willow Cir is a home located in Champaign County with nearby schools including Centennial High School, St John Lutheran School, and Judah Christian School.
Ownership History
Date
Name
Owned For
Owner Type
Purchase Details
Closed on
Jul 21, 2021
Sold by
Lam Tim Tim
Bought by
Gadeken Dyana
Current Estimated Value
Home Financials for this Owner
Home Financials are based on the most recent Mortgage that was taken out on this home.
Original Mortgage
$183,612
Outstanding Balance
$166,343
Interest Rate
2.8%
Mortgage Type
FHA
Estimated Equity
$148,948
Purchase Details
Closed on
Feb 19, 2013
Sold by
Hayes Keith Q and Cornejo Gonzales Rosa Ivone
Bought by
Lam Tim Tim
Home Financials for this Owner
Home Financials are based on the most recent Mortgage that was taken out on this home.
Original Mortgage
$177,500
Interest Rate
3.49%
Mortgage Type
New Conventional
Purchase Details
Closed on
Dec 1, 2008
Sold by
Bollman Brian N and Bollman Dianne M
Bought by
Hayes Keith Q
Home Financials for this Owner
Home Financials are based on the most recent Mortgage that was taken out on this home.
Original Mortgage
$184,000
Interest Rate
6.49%
Mortgage Type
Purchase Money Mortgage
Create a Home Valuation Report for This Property
The Home Valuation Report is an in-depth analysis detailing your home's value as well as a comparison with similar homes in the area
Purchase History
| Date | Buyer | Sale Price | Title Company |
|---|---|---|---|
| Gadeken Dyana | $187,000 | Attorney | |
| Lam Tim Tim | $197,500 | None Available | |
| Hayes Keith Q | $209,000 | None Available |
Source: Public Records
Mortgage History
| Date | Status | Borrower | Loan Amount |
|---|---|---|---|
| Open | Gadeken Dyana | $183,612 | |
| Previous Owner | Lam Tim Tim | $177,500 | |
| Previous Owner | Hayes Keith Q | $184,000 |
Source: Public Records
Tax History
| Year | Tax Paid | Tax Assessment Tax Assessment Total Assessment is a certain percentage of the fair market value that is determined by local assessors to be the total taxable value of land and additions on the property. | Land | Improvement |
|---|---|---|---|---|
| 2024 | $5,346 | $85,570 | $19,080 | $66,490 |
| 2023 | $5,346 | $79,010 | $17,620 | $61,390 |
| 2022 | $5,090 | $73,710 | $16,440 | $57,270 |
| 2021 | $4,889 | $72,410 | $16,150 | $56,260 |
| 2020 | $4,847 | $71,690 | $15,990 | $55,700 |
| 2019 | $4,686 | $70,490 | $15,720 | $54,770 |
| 2018 | $4,544 | $68,600 | $15,720 | $52,880 |
| 2017 | $4,345 | $65,760 | $15,720 | $50,040 |
| 2016 | $3,888 | $65,760 | $15,720 | $50,040 |
| 2015 | $3,997 | $65,760 | $15,720 | $50,040 |
| 2014 | $3,969 | $65,760 | $15,720 | $50,040 |
| 2013 | $3,903 | $65,760 | $15,720 | $50,040 |
Source: Public Records
Map
Nearby Homes
- 1850 Maynard Dr
- 1914 Woodfield Rd
- 1914 Trout Valley Dr
- 3120 Moraine Dr
- 4002 Lakepoint Rd
- 3510 S Duncan Rd
- 4203 Curtis Meadow Dr
- 4010 Clubhouse Dr
- 1610 Stratford Dr
- 1309 Maplepark Dr
- 7 Briar Hill Cir Unit G
- 4007 Turnberry Dr
- 2704 W Kirby Ave
- 2605 Trafalgar Square
- 2703 Lawndale Dr
- 2612 W Kirby Ave
- 2705 Willowpark Dr
- 4406 Crossgate Dr
- 2205 Edgewater Place
- 3906 Crail Rd
- 3504 White Willow Cir
- 3508 White Willow Cir
- 1903 Oak Park Dr
- 3505 Royal Oak Ct
- 3503 Royal Oak Ct
- 1815 Oak Park Dr
- 3502 Banat Dr
- 3502 White Willow Cir
- 3507 Royal Oak Ct
- 1813 Oak Park Dr
- 3507 White Willow Cir
- 3505 White Willow Cir
- 3503 White Willow Cir
- 3501 White Willow Cir
- 1811 Oak Park Dr
- 3508 Royal Oak Ct
- 1816 Oak Park Dr
- 1814 Oak Park Dr
- 1820 Oak Park Dr
- 3502 Royal Oak Ct
Your Personal Tour Guide
Ask me questions while you tour the home.