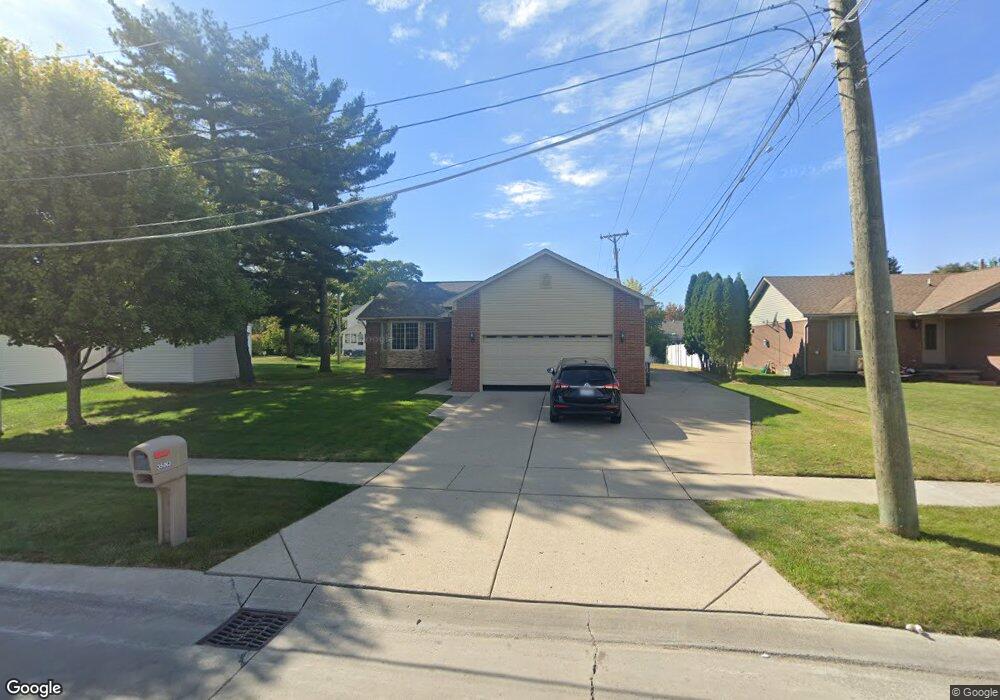
35063 Maureen Dr Unit Bldg-Unit Sterling Heights, MI 48310
Estimated Value: $301,668 - $351,000
--
Bed
2
Baths
1,352
Sq Ft
$241/Sq Ft
Est. Value
About This Home
This home is located at 35063 Maureen Dr Unit Bldg-Unit, Sterling Heights, MI 48310 and is currently estimated at $325,417, approximately $240 per square foot. 35063 Maureen Dr Unit Bldg-Unit is a home located in Macomb County with nearby schools including Harwood Elementary School, Carleton Middle School, and Sterling Heights Senior H.S..
Ownership History
Date
Name
Owned For
Owner Type
Purchase Details
Closed on
Mar 20, 2018
Sold by
Hogue Deidra M
Bought by
Zebari Samir
Current Estimated Value
Home Financials for this Owner
Home Financials are based on the most recent Mortgage that was taken out on this home.
Original Mortgage
$215,965
Outstanding Balance
$185,327
Interest Rate
4.44%
Mortgage Type
FHA
Estimated Equity
$140,090
Purchase Details
Closed on
Sep 5, 2013
Sold by
Wright Richard and Wright Beverly Ann
Bought by
Hogue Deidra M
Purchase Details
Closed on
Jun 25, 2001
Sold by
Briarwood Builders Inc
Bought by
Wright Richard
Home Financials for this Owner
Home Financials are based on the most recent Mortgage that was taken out on this home.
Original Mortgage
$135,900
Interest Rate
6.97%
Mortgage Type
Purchase Money Mortgage
Create a Home Valuation Report for This Property
The Home Valuation Report is an in-depth analysis detailing your home's value as well as a comparison with similar homes in the area
Home Values in the Area
Average Home Value in this Area
Purchase History
| Date | Buyer | Sale Price | Title Company |
|---|---|---|---|
| Zebari Samir | $219,950 | Premier Title Agency Llc | |
| Hogue Deidra M | $169,900 | Capital Title Insurance Agen | |
| Wright Richard | $169,900 | -- |
Source: Public Records
Mortgage History
| Date | Status | Borrower | Loan Amount |
|---|---|---|---|
| Open | Zebari Samir | $215,965 | |
| Previous Owner | Wright Richard | $135,900 |
Source: Public Records
Tax History Compared to Growth
Tax History
| Year | Tax Paid | Tax Assessment Tax Assessment Total Assessment is a certain percentage of the fair market value that is determined by local assessors to be the total taxable value of land and additions on the property. | Land | Improvement |
|---|---|---|---|---|
| 2025 | $4,607 | $135,900 | $0 | $0 |
| 2024 | $4,444 | $129,400 | $0 | $0 |
| 2023 | $4,218 | $116,900 | $0 | $0 |
| 2022 | $4,091 | $110,000 | $0 | $0 |
| 2021 | $4,228 | $105,900 | $0 | $0 |
| 2020 | $4,019 | $92,700 | $0 | $0 |
| 2019 | $3,964 | $91,000 | $0 | $0 |
| 2018 | $3,281 | $84,900 | $0 | $0 |
| 2017 | $3,166 | $80,200 | $19,200 | $61,000 |
| 2016 | $3,098 | $80,200 | $0 | $0 |
| 2015 | -- | $74,400 | $0 | $0 |
| 2014 | -- | $68,100 | $0 | $0 |
Source: Public Records
Map
Nearby Homes
- 35554 Buxton Dr
- 5336 Mansfield Ave
- 5072 15 Mile Rd
- 34641 Mound Rd
- 5049 Surrey Dr
- 5555 Kreger St
- 5072 Chadbourne Dr
- 35259 Hatherly Place
- 4655 Ashburton Place
- 5315 Plymouth St
- 4874 Venetian Dr
- 4946 Vista Ct
- 5353 Northlawn Dr
- 35272 Vito Dr
- 4908 Kadena Ct
- 35078 Cavant Dr
- 5018 Northlawn (Ranch) Dr
- 4628 Dickson Dr
- 4468 15 Mile Rd Unit F104
- 5018 Northlawn Dr
- 35063 Maureen Dr
- 35075 Maureen Dr
- 5599 15 Mile Rd
- 35040 Maureen Dr
- 5525 15 Mile Rd
- 5586 Bryan Dr
- 35092 Wright Cir
- 5574 Bryan Dr
- 5562 Bryan Dr
- 35060 Wright Cir
- 35102 Maureen Dr
- 35048 Wright Cir
- 5600 15 Mile Rd
- 5585 Bryan Dr
- 5600 Fifteen Mile Rd
- 35114 Maureen Dr
- 5573 Bryan Dr
- 35105 Wright Cir
- 35036 Wright Cir Unit Bldg-Unit
- 35036 Wright Cir