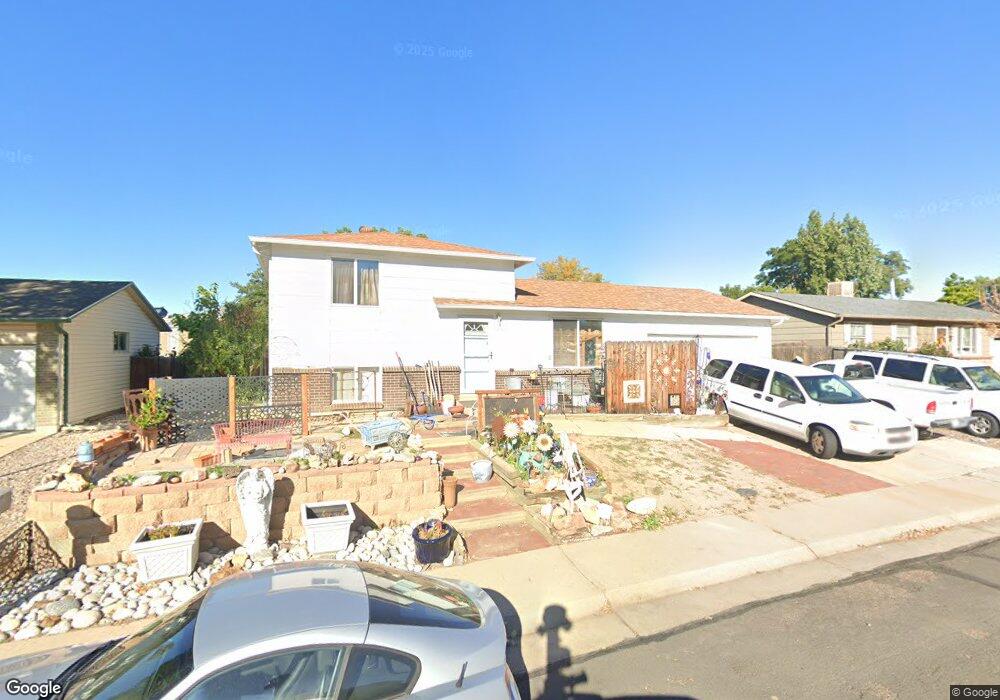
3507 E 118th Ave Thornton, CO 80233
Woodglen NeighborhoodEstimated Value: $443,098 - $532,000
3
Beds
1
Bath
1,770
Sq Ft
$272/Sq Ft
Est. Value
About This Home
This home is located at 3507 E 118th Ave, Thornton, CO 80233 and is currently estimated at $481,775, approximately $272 per square foot. 3507 E 118th Ave is a home located in Adams County with nearby schools including Woodglen Elementary School, Century Middle School, and Mountain Range High School.
Ownership History
Date
Name
Owned For
Owner Type
Purchase Details
Closed on
Feb 2, 2018
Sold by
Adkinson Melissa W
Bought by
Adkinson Melissa W
Current Estimated Value
Home Financials for this Owner
Home Financials are based on the most recent Mortgage that was taken out on this home.
Original Mortgage
$73,700
Interest Rate
3.99%
Mortgage Type
New Conventional
Purchase Details
Closed on
Apr 21, 2014
Sold by
Adkinson Dexter B
Bought by
Adkinson Dexter B and Adkinson Melissa
Home Financials for this Owner
Home Financials are based on the most recent Mortgage that was taken out on this home.
Original Mortgage
$88,000
Interest Rate
4.16%
Mortgage Type
New Conventional
Purchase Details
Closed on
Nov 21, 2005
Sold by
Adkinson Melissa W
Bought by
Adkinson Dexter B
Create a Home Valuation Report for This Property
The Home Valuation Report is an in-depth analysis detailing your home's value as well as a comparison with similar homes in the area
Home Values in the Area
Average Home Value in this Area
Purchase History
| Date | Buyer | Sale Price | Title Company |
|---|---|---|---|
| Adkinson Melissa W | -- | Nextitle | |
| Adkinson Melissa W | -- | Nextitle | |
| Adkinson Dexter B | -- | First American Title Ins Co | |
| Adkinson Dexter B | -- | -- |
Source: Public Records
Mortgage History
| Date | Status | Borrower | Loan Amount |
|---|---|---|---|
| Closed | Adkinson Melissa W | $73,700 | |
| Closed | Adkinson Dexter B | $88,000 |
Source: Public Records
Tax History
| Year | Tax Paid | Tax Assessment Tax Assessment Total Assessment is a certain percentage of the fair market value that is determined by local assessors to be the total taxable value of land and additions on the property. | Land | Improvement |
|---|---|---|---|---|
| 2025 | $1,891 | $23,800 | $6,600 | $17,200 |
| 2024 | $1,891 | $26,870 | $6,060 | $20,810 |
| 2023 | $1,872 | $31,260 | $6,090 | $25,170 |
| 2022 | $1,655 | $21,970 | $6,050 | $15,920 |
| 2021 | $1,708 | $21,970 | $6,050 | $15,920 |
| 2020 | $1,783 | $23,130 | $6,220 | $16,910 |
| 2019 | $1,786 | $23,130 | $6,220 | $16,910 |
| 2018 | $1,354 | $18,970 | $5,760 | $13,210 |
| 2017 | $1,231 | $18,970 | $5,760 | $13,210 |
| 2016 | $932 | $16,630 | $3,180 | $13,450 |
| 2015 | $930 | $8,680 | $1,660 | $7,020 |
| 2014 | $743 | $6,720 | $1,350 | $5,370 |
Source: Public Records
Map
Nearby Homes
- 3491 E 119th St
- 11909 Monroe St
- 11867 Jackson Cir
- 11776 Saint Paul St
- 2789 E 118th Cir
- 4160 E 119th Place Unit B
- 2656 E 117th Way
- 11961 Bellaire St Unit C
- 4145 E 119th Place Unit B
- 11981 Bellaire St Unit D
- 4220 E 119th Place Unit B
- 11731 Ash St
- 3991 E 121st Ave
- 12218 Adams St
- 12237 Cook Ct
- 4319 E 118th Ave
- 12251 Cook Ct
- 3422 E 114th Dr
- 4402 E 117th Ct
- 11510 Milwaukee St
- 3511 E 118th Ave
- 3501 E 118th Ave
- 11881 Madison Place
- 3521 E 118th Ave
- 3510 E 118th Ave
- 3520 E 118th Ave
- 3500 E 118th Ave
- 11883 Madison Place
- 11872 Madison Place
- 11874 Madison Place
- 3530 E 118th Ave
- 11885 Madison Place
- 3531 E 118th Ave
- 3420 E 119th St
- 11887 Madison Place
- 11873 Monroe St
- 11883 Monroe St
- 3549 E 117th Place
- 11790 Madison St
- 11786 Madison St
Your Personal Tour Guide
Ask me questions while you tour the home.