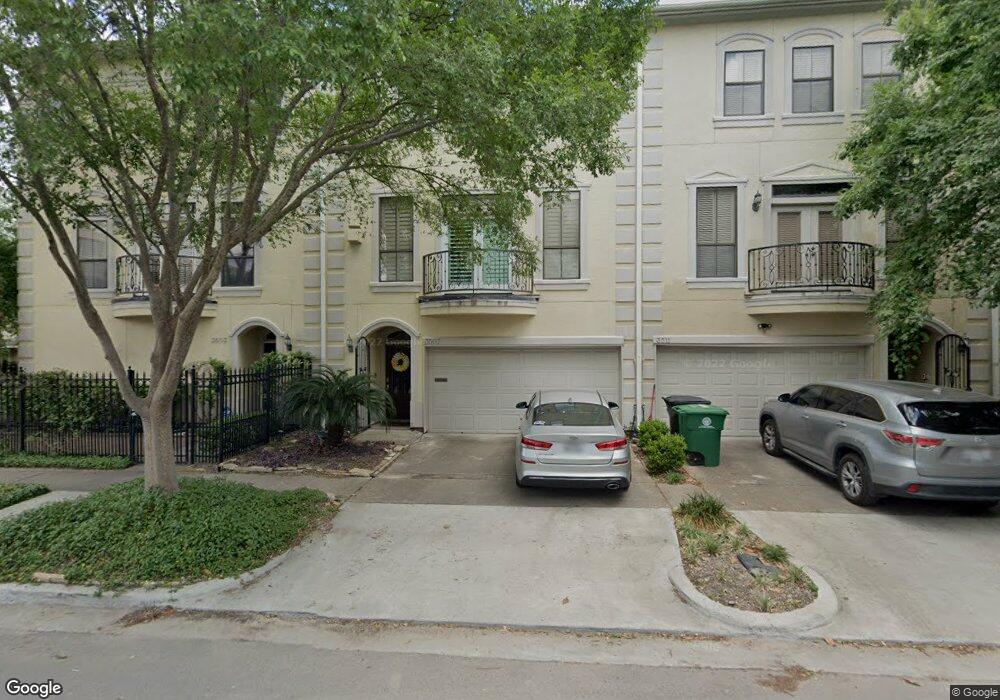
3507 Yupon St Houston, TX 77006
Montrose NeighborhoodEstimated Value: $504,519 - $612,000
3
Beds
4
Baths
2,302
Sq Ft
$241/Sq Ft
Est. Value
About This Home
This home is located at 3507 Yupon St, Houston, TX 77006 and is currently estimated at $554,130, approximately $240 per square foot. 3507 Yupon St is a home located in Harris County with nearby schools including Baker Montessori, Lanier Middle School, and Lamar High School.
Ownership History
Date
Name
Owned For
Owner Type
Purchase Details
Closed on
Aug 19, 2011
Sold by
Household Finance Corp Iii
Bought by
Whiteside Julie
Current Estimated Value
Home Financials for this Owner
Home Financials are based on the most recent Mortgage that was taken out on this home.
Original Mortgage
$220,000
Outstanding Balance
$152,041
Interest Rate
4.53%
Mortgage Type
New Conventional
Estimated Equity
$402,089
Purchase Details
Closed on
Nov 2, 2010
Sold by
Moreland Jon Lindsay
Bought by
Household Finance Corp Iii
Purchase Details
Closed on
Jul 28, 2000
Sold by
Silverwood Builders Inc
Bought by
Moreland Jon Lindsay
Home Financials for this Owner
Home Financials are based on the most recent Mortgage that was taken out on this home.
Original Mortgage
$288,000
Interest Rate
11.75%
Create a Home Valuation Report for This Property
The Home Valuation Report is an in-depth analysis detailing your home's value as well as a comparison with similar homes in the area
Home Values in the Area
Average Home Value in this Area
Purchase History
| Date | Buyer | Sale Price | Title Company |
|---|---|---|---|
| Whiteside Julie | -- | Lsi Title Agency Inc | |
| Household Finance Corp Iii | $247,731 | None Available | |
| Moreland Jon Lindsay | -- | -- |
Source: Public Records
Mortgage History
| Date | Status | Borrower | Loan Amount |
|---|---|---|---|
| Open | Whiteside Julie | $220,000 | |
| Previous Owner | Moreland Jon Lindsay | $288,000 |
Source: Public Records
Tax History Compared to Growth
Tax History
| Year | Tax Paid | Tax Assessment Tax Assessment Total Assessment is a certain percentage of the fair market value that is determined by local assessors to be the total taxable value of land and additions on the property. | Land | Improvement |
|---|---|---|---|---|
| 2025 | $6,845 | $421,387 | $141,130 | $280,257 |
| 2024 | $6,845 | $460,000 | $141,130 | $318,870 |
| 2023 | $6,845 | $472,524 | $141,130 | $331,394 |
| 2022 | $9,246 | $419,905 | $115,470 | $304,435 |
| 2021 | $9,299 | $399,000 | $134,715 | $264,285 |
| 2020 | $9,628 | $397,584 | $126,650 | $270,934 |
| 2019 | $11,020 | $435,514 | $101,320 | $334,194 |
| 2018 | $8,792 | $447,000 | $101,320 | $345,680 |
| 2017 | $11,965 | $450,900 | $101,320 | $349,580 |
| 2016 | $12,059 | $463,000 | $101,320 | $361,680 |
| 2015 | $7,585 | $470,000 | $101,320 | $368,680 |
| 2014 | $7,585 | $415,000 | $88,655 | $326,345 |
Source: Public Records
Map
Nearby Homes
- 3515 Yupon St
- 3403 Yupon St
- 3540 Yupon St
- 1503 Harold St
- 3311 Yupon St Unit 611
- 3311 Yupon St Unit 519
- 1621 California St
- 1507 Kipling St
- 1511 Kipling St
- 1510 Marshall St
- 1517 Kipling St
- 1101 Hawthorne St
- 1540 Hawthorne St Unit 4
- 1539 Westheimer Rd
- 1512 W Alabama St
- 1531 Marshall St Unit 3
- 1612 Kipling St
- 3705 Mandell St Unit 8
- 1620 Harold St
- 1621 Cherryhurst St
- 3511 Yupon St
- 3503 Yupon St
- 1311 Harold St
- 1311 Harold St
- 1313 Harold St
- 1315 Harold St
- 3519 Yupon St
- 1309 Harold St
- 3506 Yupon St
- 3502 Yupon St
- 1401 Harold St
- 3510 Yupon St
- 3523 Yupon St
- 1312 Harold St Unit 4
- 1318 Harold St Unit 1
- 1316 Harold St Unit 2
- 1310 Harold St Unit 5
- 1314 Harold St Unit 3
- 3520 Yupon St
- 1318 Kipling St