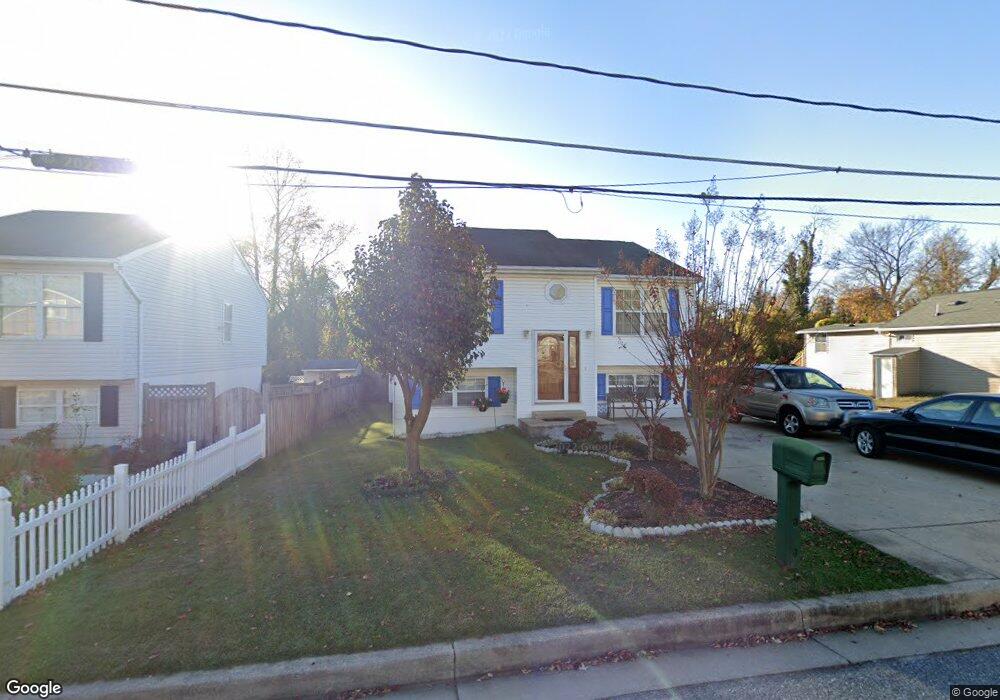
3508 Clover Ave Halethorpe, MD 21227
Lansdowne NeighborhoodEstimated Value: $324,874 - $399,000
Studio
3
Baths
1,104
Sq Ft
$323/Sq Ft
Est. Value
About This Home
This home is located at 3508 Clover Ave, Halethorpe, MD 21227 and is currently estimated at $356,719, approximately $323 per square foot. 3508 Clover Ave is a home located in Baltimore County with nearby schools including Lansdowne Elementary School, Lansdowne Middle School, and Lansdowne High School.
Ownership History
Date
Name
Owned For
Owner Type
Purchase Details
Closed on
Dec 28, 2005
Sold by
Lamartina Phillip W
Bought by
Flores Pedro A and Flores Elsa
Current Estimated Value
Home Financials for this Owner
Home Financials are based on the most recent Mortgage that was taken out on this home.
Original Mortgage
$57,400
Interest Rate
6.17%
Mortgage Type
Stand Alone Second
Purchase Details
Closed on
Nov 23, 2005
Sold by
Lamartina Phillip W
Bought by
Flores Pedro A and Flores Elsa
Home Financials for this Owner
Home Financials are based on the most recent Mortgage that was taken out on this home.
Original Mortgage
$57,400
Interest Rate
6.17%
Mortgage Type
Stand Alone Second
Purchase Details
Closed on
Nov 4, 1994
Sold by
Sherman Bldrs Inc
Bought by
Lamartina Phillip W
Home Financials for this Owner
Home Financials are based on the most recent Mortgage that was taken out on this home.
Original Mortgage
$105,800
Interest Rate
8.71%
Create a Home Valuation Report for This Property
The Home Valuation Report is an in-depth analysis detailing your home's value as well as a comparison with similar homes in the area
Home Values in the Area
Average Home Value in this Area
Purchase History
| Date | Buyer | Sale Price | Title Company |
|---|---|---|---|
| Flores Pedro A | $287,000 | -- | |
| Flores Pedro A | $287,000 | -- | |
| Lamartina Phillip W | $105,900 | -- |
Source: Public Records
Mortgage History
| Date | Status | Borrower | Loan Amount |
|---|---|---|---|
| Closed | Flores Pedro A | $57,400 | |
| Open | Flores Pedro A | $229,600 | |
| Closed | Flores Pedro A | $229,600 | |
| Previous Owner | Lamartina Phillip W | $105,800 |
Source: Public Records
Tax History
| Year | Tax Paid | Tax Assessment Tax Assessment Total Assessment is a certain percentage of the fair market value that is determined by local assessors to be the total taxable value of land and additions on the property. | Land | Improvement |
|---|---|---|---|---|
| 2025 | $1,746 | $236,767 | -- | -- |
| 2024 | $1,746 | $217,600 | $62,600 | $155,000 |
| 2023 | $1,735 | $215,133 | $0 | $0 |
| 2022 | $1,701 | $212,667 | $0 | $0 |
| 2021 | $3,227 | $210,200 | $62,600 | $147,600 |
| 2020 | $3,227 | $204,567 | $0 | $0 |
| 2019 | $3,122 | $198,933 | $0 | $0 |
| 2018 | $2,954 | $193,300 | $62,600 | $130,700 |
| 2017 | $2,820 | $192,267 | $0 | $0 |
| 2016 | $2,721 | $191,233 | $0 | $0 |
| 2015 | $2,721 | $190,200 | $0 | $0 |
| 2014 | $2,721 | $190,200 | $0 | $0 |
Source: Public Records
Map
Nearby Homes
- 3504 Shenandoah Ave
- 418 1st Ave
- 401 2nd Ave
- 3207 Janice Ave
- 801 Seckel Ct
- 302 4th Ave
- 2707 Marbourne Ave
- 238 Elizabeth Ave
- 4157 Hollins Ferry Rd
- 2818 Rose Ave
- 2916 Rayshire Rd
- 216 Clyde Ave
- 3008 Huron St
- 2828 Alabama Ave
- 2812 Florida Ave
- 35 Elizabeth Ave
- 2909 Louisiana Ave
- 104 Ridge Ave
- 2421 Arbuton Ave
- 2902 Michigan Ave
- 3510 Clover Ave
- 3506 Clover Ave
- 3512 Clover Ave
- 3504 Clover Ave
- 3511 Clover Ave
- 3513 Clover Ave
- 3515 Clover Ave
- 2611 First Ave
- 3505 Clover Ave
- 0 Lansdowne Rd
- 3512 Shenandoah Ave
- 3501 Clover Ave
- 3508 Shenandoah Ave
- 3502 Shenandoah Ave
- 2616 First Ave
- 3507 Shenandoah Ave
- 2620 First Ave
- 3505 Shenandoah Ave
- 3505 Shenandoah Ave Unit B
- 3501 Shenandoah Ave
Your Personal Tour Guide
Ask me questions while you tour the home.