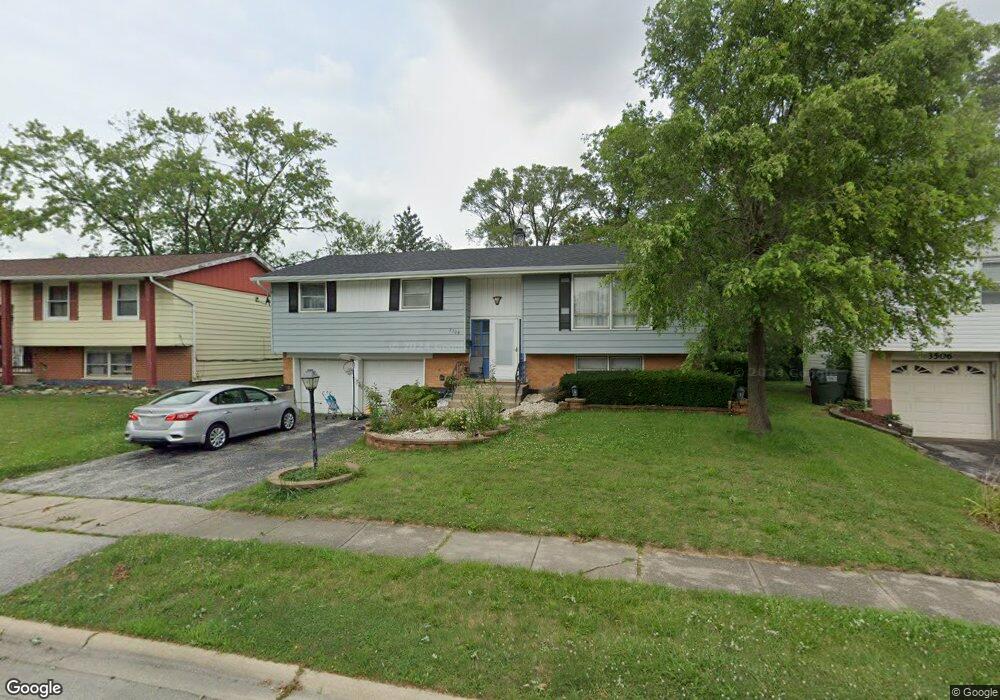
3508 Hazel Ln Hazel Crest, IL 60429
Estimated Value: $188,000 - $235,000
3
Beds
1
Bath
1,200
Sq Ft
$173/Sq Ft
Est. Value
About This Home
This home is located at 3508 Hazel Ln, Hazel Crest, IL 60429 and is currently estimated at $207,796, approximately $173 per square foot. 3508 Hazel Ln is a home located in Cook County with nearby schools including Highlands Elementary School, Prairie-Hills Junior High School, and Hillcrest High School.
Ownership History
Date
Name
Owned For
Owner Type
Purchase Details
Closed on
Sep 17, 2009
Sold by
Secretary Of Housing & Urban Development
Bought by
Frelix Sarah
Current Estimated Value
Home Financials for this Owner
Home Financials are based on the most recent Mortgage that was taken out on this home.
Original Mortgage
$58,999
Outstanding Balance
$37,935
Interest Rate
5.1%
Mortgage Type
FHA
Estimated Equity
$169,861
Purchase Details
Closed on
Sep 23, 2008
Sold by
Quinn Calvin
Bought by
Secretary Of Housing & Urban Development
Purchase Details
Closed on
May 1, 2000
Sold by
Zink Richard T and Zink Norma J
Bought by
Quinn Calvin and Quinn Marie
Home Financials for this Owner
Home Financials are based on the most recent Mortgage that was taken out on this home.
Original Mortgage
$117,719
Interest Rate
8.13%
Mortgage Type
FHA
Create a Home Valuation Report for This Property
The Home Valuation Report is an in-depth analysis detailing your home's value as well as a comparison with similar homes in the area
Home Values in the Area
Average Home Value in this Area
Purchase History
| Date | Buyer | Sale Price | Title Company |
|---|---|---|---|
| Frelix Sarah | -- | Stewart Title Company | |
| Secretary Of Housing & Urban Development | -- | None Available | |
| Quinn Calvin | $118,000 | -- |
Source: Public Records
Mortgage History
| Date | Status | Borrower | Loan Amount |
|---|---|---|---|
| Open | Frelix Sarah | $58,999 | |
| Previous Owner | Quinn Calvin | $117,719 |
Source: Public Records
Tax History
| Year | Tax Paid | Tax Assessment Tax Assessment Total Assessment is a certain percentage of the fair market value that is determined by local assessors to be the total taxable value of land and additions on the property. | Land | Improvement |
|---|---|---|---|---|
| 2025 | $7,522 | $18,000 | $3,281 | $14,719 |
| 2024 | $7,522 | $18,000 | $3,281 | $14,719 |
| 2023 | $4,440 | $18,000 | $3,281 | $14,719 |
| 2022 | $4,440 | $9,469 | $2,776 | $6,693 |
| 2021 | $4,343 | $9,468 | $2,776 | $6,692 |
| 2020 | $4,276 | $9,468 | $2,776 | $6,692 |
| 2019 | $4,388 | $9,982 | $2,524 | $7,458 |
| 2018 | $4,248 | $9,982 | $2,524 | $7,458 |
| 2017 | $4,005 | $9,982 | $2,524 | $7,458 |
| 2016 | $3,826 | $9,041 | $2,271 | $6,770 |
| 2015 | $3,595 | $9,041 | $2,271 | $6,770 |
| 2014 | $3,536 | $9,041 | $2,271 | $6,770 |
| 2013 | $4,032 | $11,048 | $2,271 | $8,777 |
Source: Public Records
Map
Nearby Homes
- 17316 Central Park Ave
- 17213 Springtide Ln
- 17206 Elm Dr
- 3321 173rd St
- 3511 Laurel Ln
- 17303 Appletree Dr
- 17113 Elm Dr
- 3311 Hickory Ln
- 17306 Burr Oak Ln
- 3312 Maple Ln
- 3213 Woodworth Place
- 3806 172nd St
- 17640 Central Park Ave
- 17651 Hillcrest Dr
- 17007 Elm Dr
- 3318 Tulip Dr
- 17000 Magnolia Dr
- 3509 Birchwood Dr
- 3425 Birchwood Dr
- 17417 Kedzie Ave
- 3510 Hazel Ln
- 3506 Hazel Ln
- 3504 Hazel Ln
- 3512 Hazel Ln
- 3509 Woodworth Place
- 3511 Woodworth Place
- 3507 Woodworth Place
- 17303 Central Park Ave
- 17305 Central Park Ave
- 3513 Woodworth Place
- 3502 Hazel Ln
- 17301 Central Park Ave
- 3505 Woodworth Place
- 3505 Hazel Ln
- 3509 Hazel Ln
- 17307 Central Park Ave
- 3503 Hazel Ln
- 3503 Woodworth Place
- 3515 Woodworth Place
- 3500 Hazel Ln
Your Personal Tour Guide
Ask me questions while you tour the home.