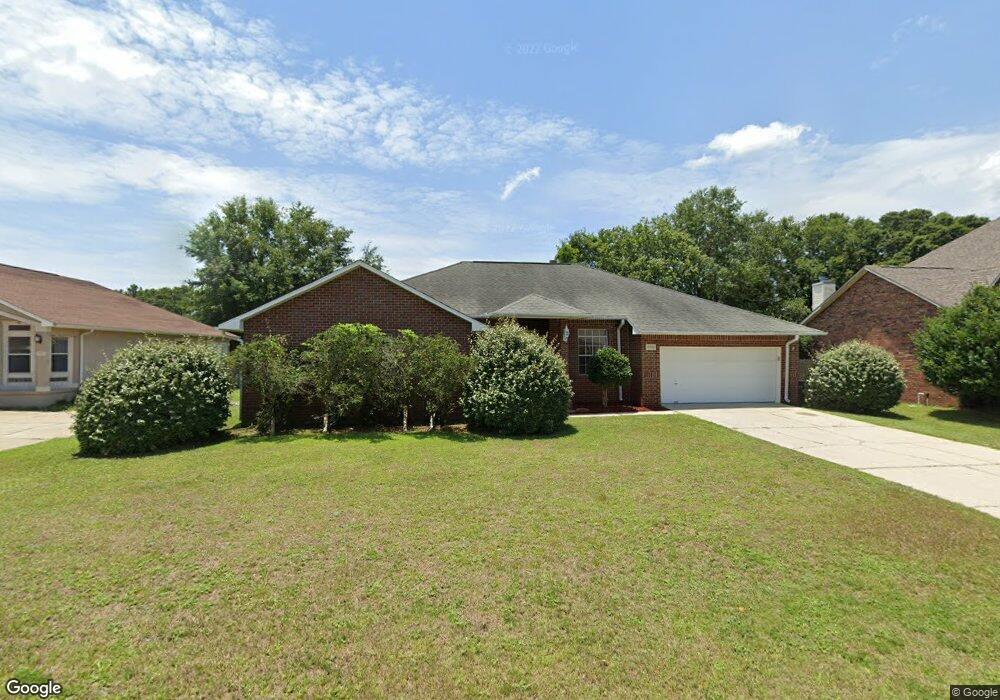
3509 Ashmore Ln Milton, FL 32571
Estimated Value: $386,000 - $494,000
4
Beds
2
Baths
2,777
Sq Ft
$151/Sq Ft
Est. Value
About This Home
This home is located at 3509 Ashmore Ln, Milton, FL 32571 and is currently estimated at $420,036, approximately $151 per square foot. 3509 Ashmore Ln is a home located in Santa Rosa County with nearby schools including Pace High School.
Ownership History
Date
Name
Owned For
Owner Type
Purchase Details
Closed on
Feb 22, 2003
Sold by
Ferrell David D and Ferrell Lisa A
Bought by
Cockrum Scott D and Cockrum Elizabeth L
Current Estimated Value
Home Financials for this Owner
Home Financials are based on the most recent Mortgage that was taken out on this home.
Original Mortgage
$169,750
Interest Rate
5.79%
Purchase Details
Closed on
Aug 7, 2001
Sold by
Davern Anthony J and Davern Dawn L
Bought by
Ferrell David D and Ferrell Lisa A
Home Financials for this Owner
Home Financials are based on the most recent Mortgage that was taken out on this home.
Original Mortgage
$166,644
Interest Rate
7.19%
Purchase Details
Closed on
Mar 28, 1996
Sold by
J B L Prop Ltd
Bought by
Davern Anthony J and Davern Dawn L
Home Financials for this Owner
Home Financials are based on the most recent Mortgage that was taken out on this home.
Original Mortgage
$129,450
Interest Rate
6.9%
Purchase Details
Closed on
Nov 3, 1995
Sold by
Livings M J and Livings Grace K
Bought by
J B L Prop Ltd
Create a Home Valuation Report for This Property
The Home Valuation Report is an in-depth analysis detailing your home's value as well as a comparison with similar homes in the area
Home Values in the Area
Average Home Value in this Area
Purchase History
| Date | Buyer | Sale Price | Title Company |
|---|---|---|---|
| Cockrum Scott D | $175,000 | -- | |
| Ferrell David D | $185,200 | -- | |
| Davern Anthony J | $136,300 | -- | |
| J B L Prop Ltd | $13,600 | -- |
Source: Public Records
Mortgage History
| Date | Status | Borrower | Loan Amount |
|---|---|---|---|
| Previous Owner | Cockrum Scott D | $169,750 | |
| Previous Owner | Ferrell David D | $166,644 | |
| Previous Owner | Davern Anthony J | $129,450 |
Source: Public Records
Tax History
| Year | Tax Paid | Tax Assessment Tax Assessment Total Assessment is a certain percentage of the fair market value that is determined by local assessors to be the total taxable value of land and additions on the property. | Land | Improvement |
|---|---|---|---|---|
| 2025 | $3,823 | $306,312 | $43,000 | $263,312 |
| 2024 | $3,791 | $294,056 | $43,000 | $251,056 |
| 2023 | $3,791 | $291,318 | $43,000 | $248,318 |
| 2022 | $3,536 | $274,221 | $32,000 | $242,221 |
| 2021 | $3,180 | $230,536 | $23,000 | $207,536 |
| 2020 | $3,018 | $217,626 | $0 | $0 |
| 2019 | $2,815 | $202,700 | $0 | $0 |
| 2018 | $2,537 | $188,488 | $0 | $0 |
| 2017 | $2,377 | $176,727 | $0 | $0 |
| 2016 | $2,368 | $172,158 | $0 | $0 |
| 2015 | $2,340 | $165,815 | $0 | $0 |
| 2014 | $2,420 | $169,036 | $0 | $0 |
Source: Public Records
Map
Nearby Homes
- 3573 Victory Dr
- 3431 Ashmore Ln
- 5553 Berrybrook Cir
- 5703 Berrybrook Cr
- 3505 Stratford Ln
- 3668 Berrypatch Ln
- 3656 Sawmill Cir
- 3735 Berrypatch Ln
- Lot 13 Brooks Ln
- Lot 12 Brooks Ln
- Lot 16 Brooks Ln
- Lot 15 Brooks Ln
- Lot 10 Brooks Ln
- Lot 18 Brooks Ln
- Lot 11 Brooks Ln
- Lot 17 Brooks Ln
- Lot 14 Brooks Ln
- Lot 9 Brooks Ln
- 3712 Laverne Dr
- 5509 Sunkist Cir
- 3503 Ashmore Ln
- 3515 Ashmore Ln
- 3497 Ashmore Ln
- 3504 Ashmore Ln
- 3510 Ashmore Ln
- 3498 Ashmore Ln
- 3516 Ashmore Ln
- 3491 Ashmore Ln
- 3527 Ashmore Ln
- 3492 Ashmore Ln
- 3522 Ashmore Ln
- 3533 Ashmore Ln
- 3528 Ashmore Ln
- 3486 Ashmore Ln
- 3479 Ashmore Ln
- 3534 Ashmore Ln
- 3480 Ashmore Ln
- 3545 Ashmore Ln
- 3527 Berryhill Rd
- 3390 Berryhill Oaks Ct
Your Personal Tour Guide
Ask me questions while you tour the home.