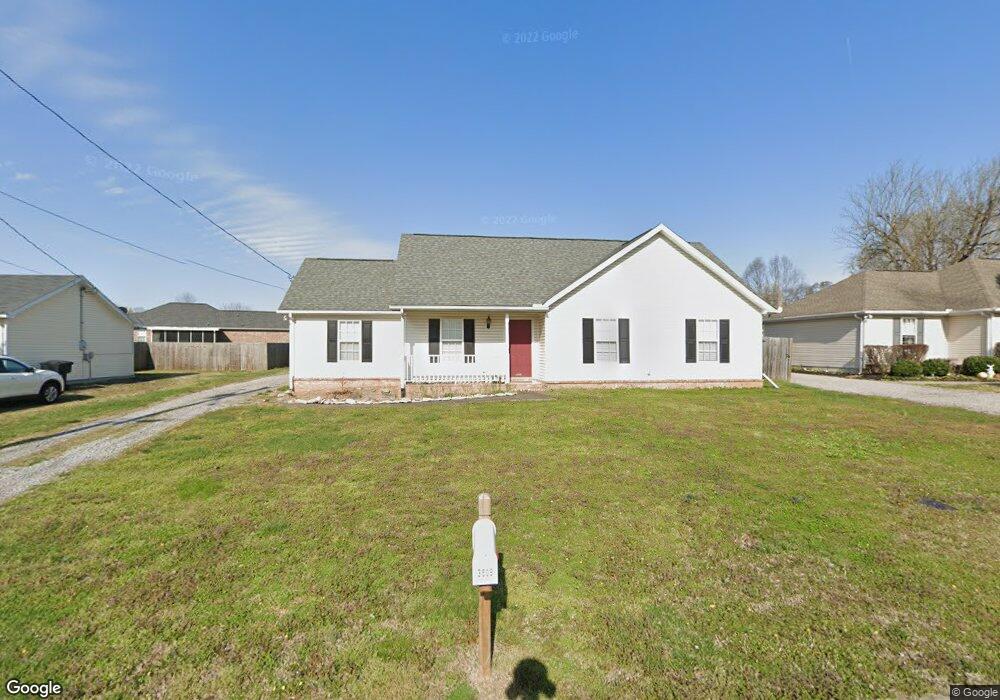
3509 Crape Cir Murfreesboro, TN 37129
Estimated Value: $280,274 - $354,000
Studio
2
Baths
1,247
Sq Ft
$260/Sq Ft
Est. Value
About This Home
This home is located at 3509 Crape Cir, Murfreesboro, TN 37129 and is currently estimated at $324,819, approximately $260 per square foot. 3509 Crape Cir is a home located in Rutherford County with nearby schools including Brown's Chapel Elementary School, Northfield Elementary School, and Blackman Middle School.
Ownership History
Date
Name
Owned For
Owner Type
Purchase Details
Closed on
Oct 19, 2020
Sold by
Cooper Robert F and Cooper Rosella H
Bought by
Cooper Robert F
Current Estimated Value
Home Financials for this Owner
Home Financials are based on the most recent Mortgage that was taken out on this home.
Original Mortgage
$210,000
Outstanding Balance
$168,700
Interest Rate
2.8%
Mortgage Type
Future Advance Clause Open End Mortgage
Estimated Equity
$156,119
Purchase Details
Closed on
Sep 12, 2011
Sold by
Sullivan Billy C
Bought by
Cooper Robert F
Home Financials for this Owner
Home Financials are based on the most recent Mortgage that was taken out on this home.
Original Mortgage
$83,200
Interest Rate
4.38%
Mortgage Type
Commercial
Purchase Details
Closed on
Aug 31, 2009
Sold by
Sullivan Billy C
Bought by
Sullivan Billy C
Purchase Details
Closed on
May 10, 2004
Sold by
Theluis Rosier
Bought by
Sullivan Billy C and Sullivan Candace
Home Financials for this Owner
Home Financials are based on the most recent Mortgage that was taken out on this home.
Original Mortgage
$105,154
Interest Rate
5.49%
Create a Home Valuation Report for This Property
The Home Valuation Report is an in-depth analysis detailing your home's value as well as a comparison with similar homes in the area
Home Values in the Area
Average Home Value in this Area
Purchase History
| Date | Buyer | Sale Price | Title Company |
|---|---|---|---|
| Cooper Robert F | -- | None Available | |
| Cooper Robert F | $104,000 | -- | |
| Sullivan Billy C | $115,000 | -- | |
| Sullivan Billy C | $106,845 | -- |
Source: Public Records
Mortgage History
| Date | Status | Borrower | Loan Amount |
|---|---|---|---|
| Open | Cooper Robert F | $210,000 | |
| Closed | Cooper Robert F | $83,200 | |
| Previous Owner | Sullivan Billy C | $105,154 |
Source: Public Records
Tax History
| Year | Tax Paid | Tax Assessment Tax Assessment Total Assessment is a certain percentage of the fair market value that is determined by local assessors to be the total taxable value of land and additions on the property. | Land | Improvement |
|---|---|---|---|---|
| 2025 | -- | $62,400 | $13,750 | $48,650 |
| 2024 | $1,765 | $62,400 | $13,750 | $48,650 |
| 2023 | $1,171 | $62,400 | $13,750 | $48,650 |
| 2022 | $1,000 | $61,850 | $13,750 | $48,100 |
| 2021 | $930 | $41,900 | $8,750 | $33,150 |
| 2020 | $930 | $41,900 | $8,750 | $33,150 |
| 2019 | $930 | $41,900 | $8,750 | $33,150 |
| 2018 | $1,278 | $41,900 | $0 | $0 |
| 2017 | $1,159 | $29,800 | $0 | $0 |
| 2016 | $1,159 | $29,800 | $0 | $0 |
| 2015 | $1,159 | $29,800 | $0 | $0 |
| 2014 | $741 | $29,800 | $0 | $0 |
| 2013 | -- | $29,850 | $0 | $0 |
Source: Public Records
Map
Nearby Homes
- 5135 Green Acres Ln
- 5143 Green Acres Ln
- 3434 Florence Rd
- 4221 Nandina Ct
- 5227 Nancy Seward Dr
- 5035 Little Adams Run
- 3340 Fletz Cir
- 6516 Old Nashville Hwy
- 6731 Old Nashville Hwy
- 5342 Keystone Ct
- 3023 Columnar Ct
- 5341 Sallee Dr
- 5140 Cicada Cir
- 4917 Laura Jeanne Blvd Unit 52
- 4421 Huntwood Dr
- 5142 Stonesbattle Pkwy
- 5079 Tabitha St
- 4844 Nina Marie Ave
- 5226 Ladybug Ln
- 3050 Asbury Rd
- 3513 Crape Cir
- 3505 Crape Cir
- 3508 Calabash Cir
- 3512 Calabash Cir
- 5111 Green Acres Ln
- 3517 Crape Cir
- 3510 Crape Cir
- 5124 Chippendale Dr
- 3506 Crape Cir
- 3514 Crape Cir
- 3516 Wilbur St
- 5128 Chippendale Dr
- 5118 Chippendale Dr
- 5115 Green Acres Ln
- 3518 Crape Cir
- 3521 Crape Cir
- 3511 Calabash Cir
- 3511 Paulownia Cir
- 3507 Paulownia Cir
- 3520 Wilbur St
Your Personal Tour Guide
Ask me questions while you tour the home.