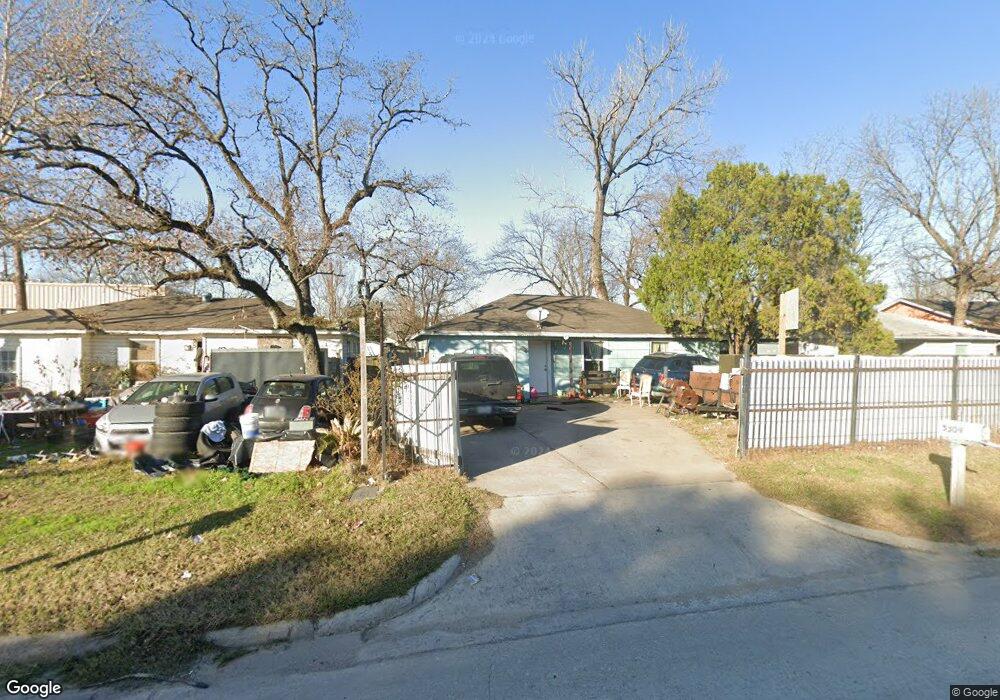
3509 Hopper Rd Houston, TX 77093
East Aldine NeighborhoodEstimated Value: $160,000 - $196,000
2
Beds
1
Bath
1,124
Sq Ft
$151/Sq Ft
Est. Value
About This Home
This home is located at 3509 Hopper Rd, Houston, TX 77093 and is currently estimated at $169,510, approximately $150 per square foot. 3509 Hopper Rd is a home located in Harris County with nearby schools including Vardeman EC/PK/K, Orange Grove Elementary School, and Macarthur Ninth Grade School.
Ownership History
Date
Name
Owned For
Owner Type
Purchase Details
Closed on
Jul 21, 2015
Sold by
Bumpurs Mary Lou and Bumpers Mary Lou
Bought by
Pulido Horacio
Current Estimated Value
Purchase Details
Closed on
Dec 11, 2009
Sold by
Santana Juan A and Santana Evanjelina
Bought by
Bumpers Mary Lou
Purchase Details
Closed on
Apr 28, 2004
Sold by
Bumpers Mary Lou
Bought by
Santana Juan A and Santana Evanjelina
Home Financials for this Owner
Home Financials are based on the most recent Mortgage that was taken out on this home.
Original Mortgage
$68,000
Interest Rate
5.38%
Mortgage Type
Seller Take Back
Purchase Details
Closed on
Apr 26, 2004
Sold by
Faith P & Charles L Bybee Foundation
Bought by
Bumpers Marylou
Home Financials for this Owner
Home Financials are based on the most recent Mortgage that was taken out on this home.
Original Mortgage
$68,000
Interest Rate
5.38%
Mortgage Type
Seller Take Back
Create a Home Valuation Report for This Property
The Home Valuation Report is an in-depth analysis detailing your home's value as well as a comparison with similar homes in the area
Home Values in the Area
Average Home Value in this Area
Purchase History
| Date | Buyer | Sale Price | Title Company |
|---|---|---|---|
| Pulido Horacio | -- | Texas American Title Co | |
| Bumpers Mary Lou | $70,000 | None Available | |
| Santana Juan A | -- | Fidelity National Title | |
| Bumpers Marylou | -- | Fidelity National Title |
Source: Public Records
Mortgage History
| Date | Status | Borrower | Loan Amount |
|---|---|---|---|
| Previous Owner | Santana Juan A | $68,000 |
Source: Public Records
Tax History Compared to Growth
Tax History
| Year | Tax Paid | Tax Assessment Tax Assessment Total Assessment is a certain percentage of the fair market value that is determined by local assessors to be the total taxable value of land and additions on the property. | Land | Improvement |
|---|---|---|---|---|
| 2025 | $2,709 | $140,000 | $68,000 | $72,000 |
| 2024 | $2,709 | $140,000 | $68,000 | $72,000 |
| 2023 | $2,709 | $118,875 | $34,000 | $84,875 |
| 2022 | $1,704 | $82,855 | $34,000 | $48,855 |
| 2021 | $1,380 | $64,026 | $34,000 | $30,026 |
| 2020 | $1,454 | $64,026 | $34,000 | $30,026 |
| 2019 | $1,201 | $50,478 | $27,200 | $23,278 |
| 2018 | $725 | $50,478 | $27,200 | $23,278 |
| 2017 | $1,144 | $50,478 | $27,200 | $23,278 |
| 2016 | $1,062 | $46,864 | $21,250 | $25,614 |
| 2015 | $1,045 | $46,864 | $21,250 | $25,614 |
| 2014 | $1,045 | $46,864 | $21,250 | $25,614 |
Source: Public Records
Map
Nearby Homes
- 3418 Hopper Rd
- 3214 Brea Crest St
- 3804 Cedar Hill Ln
- 4415 Mooney Rd
- 4007 Wedgewood St
- 3111 Hartwick Rd
- 2915 Brea Crest St
- 11206 Eastex Fwy
- 2817 Cromwell St
- 4410 Shelton Rd
- 9213 Washington St
- 1904 Little York Rd
- 2723 Castledale Dr
- 2629 Kowis St
- 1728 Little York Rd
- 2636 Lone Oak Rd
- 4522 Collins Rd
- 11716 Innsbury Dr
- 4918 Langley Rd
- 11769 Gloger St
- 3513 Hopper Rd
- 3505 Hopper Rd
- 3517 Hopper Rd
- 3521 Hopper Rd
- 3510 Wardmont St
- 3514 Wardmont St
- 3506 Wardmont St
- 3502 Wardmont St
- 3423 Hopper Rd
- 3525 Hopper Rd
- 3522 Wardmont St
- 3518 Hopper Rd
- 3426 Wardmont St
- 3514 Hopper Rd
- 3514 Hopper Rd Unit 1
- 3502 Hopper Rd
- 3601 Hopper Rd
- 3526 Wardmont St
- 3414 Hopper Rd
- 3522 Hopper Rd