Estimated Value: $425,221 - $449,000
4
Beds
2
Baths
2,131
Sq Ft
$204/Sq Ft
Est. Value
About This Home
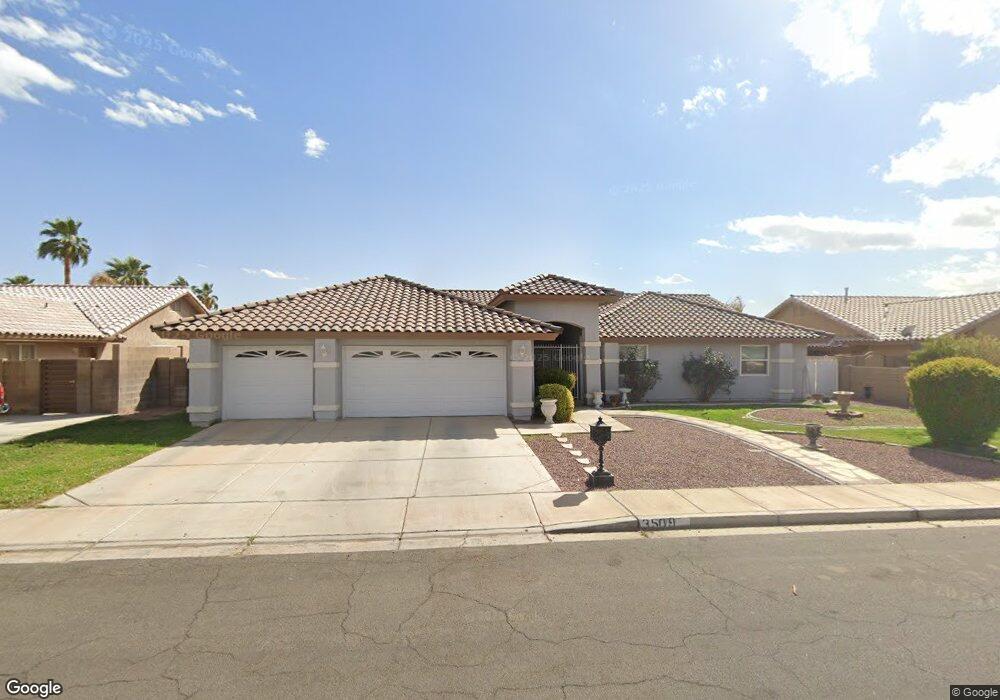
This home is located at 3509 W 20th Ln, Yuma, AZ 85364 and is currently estimated at $435,305, approximately $204 per square foot. 3509 W 20th Ln is a home located in Yuma County with nearby schools including Pueblo Elementary School, Centennial Middle School, and Cibola High School.
Ownership History
Date
Name
Owned For
Owner Type
Purchase Details
Closed on
May 20, 2020
Sold by
Kurray Anji Reddy
Bought by
Kurray Anji Reddy and Chaganti Antha
Current Estimated Value
Purchase Details
Closed on
Mar 8, 2012
Sold by
Chaganthi Anitha
Bought by
Kurray Anji Reddy
Home Financials for this Owner
Home Financials are based on the most recent Mortgage that was taken out on this home.
Original Mortgage
$165,750
Interest Rate
3.84%
Mortgage Type
New Conventional
Purchase Details
Closed on
Dec 4, 2006
Sold by
Borgman Dale A and Borgman Mary J
Bought by
Borgman Dale A and Borgman Mary J
Purchase Details
Closed on
Mar 28, 2005
Sold by
Lam Dung Hoang
Bought by
Borgman Dale A and Borgman Mary J
Purchase Details
Closed on
Sep 20, 1999
Sold by
Phuong Dao Tu
Bought by
Lam Dung Hoang
Purchase Details
Closed on
Mar 3, 1999
Sold by
Halls Development Group Llc
Bought by
Lam Dung Hoang
Create a Home Valuation Report for This Property
The Home Valuation Report is an in-depth analysis detailing your home's value as well as a comparison with similar homes in the area
Home Values in the Area
Average Home Value in this Area
Purchase History
| Date | Buyer | Sale Price | Title Company |
|---|---|---|---|
| Kurray Anji Reddy | -- | None Available | |
| Kurray Anji Reddy | -- | Pioneer Title Agency Inc | |
| Kurray Anji Reddy | $195,000 | Pioneer Title Agency Inc | |
| Borgman Dale A | -- | None Available | |
| Borgman Dale A | $278,000 | Yuma Title | |
| Lam Dung Hoang | -- | Yuma Title | |
| Lam Dung Hoang | $143,425 | Yuma Title | |
| Halls Development Group Llc | -- | Yuma Title |
Source: Public Records
Mortgage History
| Date | Status | Borrower | Loan Amount |
|---|---|---|---|
| Previous Owner | Kurray Anji Reddy | $165,750 |
Source: Public Records
Tax History Compared to Growth
Tax History
| Year | Tax Paid | Tax Assessment Tax Assessment Total Assessment is a certain percentage of the fair market value that is determined by local assessors to be the total taxable value of land and additions on the property. | Land | Improvement |
|---|---|---|---|---|
| 2025 | $2,384 | $22,015 | $4,080 | $17,935 |
| 2024 | $2,270 | $20,967 | $4,155 | $16,812 |
| 2023 | $2,270 | $19,969 | $3,460 | $16,509 |
| 2022 | $2,210 | $19,018 | $4,280 | $14,738 |
| 2021 | $2,325 | $18,112 | $4,228 | $13,884 |
| 2020 | $2,257 | $17,249 | $2,553 | $14,696 |
| 2019 | $2,219 | $16,429 | $3,748 | $12,681 |
| 2018 | $2,053 | $15,646 | $3,787 | $11,859 |
| 2017 | $2,010 | $15,646 | $3,787 | $11,859 |
| 2016 | $1,930 | $14,192 | $2,561 | $11,631 |
| 2015 | $1,573 | $13,515 | $2,535 | $10,980 |
| 2014 | $1,573 | $12,872 | $2,500 | $10,372 |
Source: Public Records
Map
Nearby Homes
- 3411 W 21st St
- 3742 W 20th Ln
- 1909 S Athens Ave
- 3770 W 20 Place
- 3435 W 18th Place
- 664-58-093 S 34th Dr
- 1937 S London Dr
- 3219 W Rome St
- 1721 S Athens Ave
- 3575 W 16th Ln
- 3017 W 17th St
- 3120 W 16th Place
- 1603 S 31st Dr
- 2521 S 36th Dr
- 4233 W 21st Place
- 2460 W Del Oro Ln
- 2133 S Quail Ave
- 2271 S 42nd Ave
- 3533 W 15th St
- 2161 S Sidewinder Ave
- 3499 W 20th Ln
- 3549 W 20th Ln
- 3510 W 21st St
- 3550 W 21st St
- 3550 W 21st St Unit PIONEER PARK
- 3500 W 21st St
- 3508 W 20th Ln
- 3599 W 20th Ln
- 3548 W 20th Ln
- 3469 W 20th Ln
- 3498 W 20th Ln
- 3570 W 21st St
- 3598 W 20th Ln
- 3468 W 20th Ln
- 3507 W 20th Place
- 3511 W 21st St
- 3609 W 20th Ln
- 3547 W 20th Place
- 3551 W 21st St
- 3497 W 20 Place