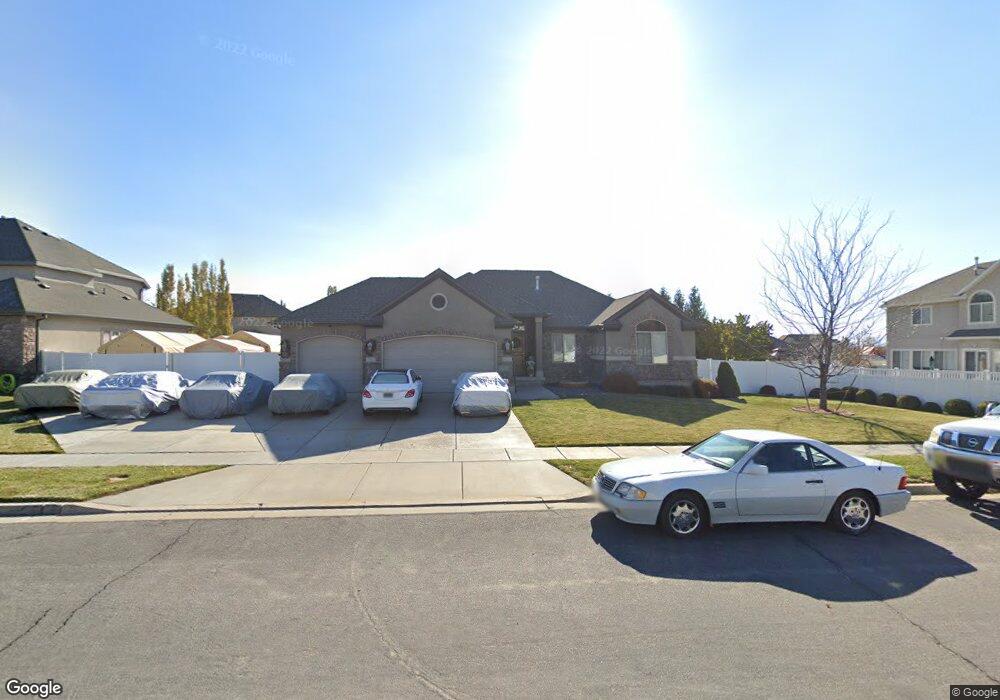
3509 W 850 N Layton, UT 84041
Estimated Value: $621,000 - $767,000
3
Beds
3
Baths
3,499
Sq Ft
$197/Sq Ft
Est. Value
About This Home
This home is located at 3509 W 850 N, Layton, UT 84041 and is currently estimated at $688,120, approximately $196 per square foot. 3509 W 850 N is a home located in Davis County with nearby schools including Sand Springs Elementary School, Legacy Junior High School, and Layton High School.
Ownership History
Date
Name
Owned For
Owner Type
Purchase Details
Closed on
Jun 27, 2025
Sold by
Movel Jenny
Bought by
Movel Alex
Current Estimated Value
Purchase Details
Closed on
Feb 26, 2007
Sold by
Stringham John E
Bought by
Movel Alex and Movel Jenny
Home Financials for this Owner
Home Financials are based on the most recent Mortgage that was taken out on this home.
Original Mortgage
$272,000
Interest Rate
6.21%
Mortgage Type
Purchase Money Mortgage
Purchase Details
Closed on
Nov 14, 2006
Sold by
North Ivory
Bought by
Stringham John E
Home Financials for this Owner
Home Financials are based on the most recent Mortgage that was taken out on this home.
Original Mortgage
$46,095
Interest Rate
5.96%
Mortgage Type
Unknown
Create a Home Valuation Report for This Property
The Home Valuation Report is an in-depth analysis detailing your home's value as well as a comparison with similar homes in the area
Home Values in the Area
Average Home Value in this Area
Purchase History
| Date | Buyer | Sale Price | Title Company |
|---|---|---|---|
| Movel Alex | -- | None Listed On Document | |
| Movel Alex | -- | Inwest Title Services | |
| Stringham John E | -- | Cottonwood Title Ins Agency |
Source: Public Records
Mortgage History
| Date | Status | Borrower | Loan Amount |
|---|---|---|---|
| Previous Owner | Movel Alex | $272,000 | |
| Previous Owner | Stringham John E | $46,095 | |
| Previous Owner | Stringham John E | $230,629 |
Source: Public Records
Tax History Compared to Growth
Tax History
| Year | Tax Paid | Tax Assessment Tax Assessment Total Assessment is a certain percentage of the fair market value that is determined by local assessors to be the total taxable value of land and additions on the property. | Land | Improvement |
|---|---|---|---|---|
| 2025 | $3,249 | $341,000 | $143,123 | $197,877 |
| 2024 | $3,100 | $327,799 | $150,923 | $176,876 |
| 2023 | $3,031 | $310,750 | $90,482 | $220,267 |
| 2022 | $3,201 | $589,000 | $168,520 | $420,480 |
| 2021 | $2,915 | $440,000 | $138,984 | $301,016 |
| 2020 | $2,638 | $382,000 | $119,598 | $262,402 |
| 2019 | $2,524 | $358,000 | $116,154 | $241,846 |
| 2018 | $2,339 | $333,000 | $102,588 | $230,412 |
| 2016 | $2,165 | $159,060 | $43,702 | $115,358 |
| 2015 | $2,344 | $163,460 | $43,702 | $119,758 |
| 2014 | $1,972 | $140,635 | $43,702 | $96,933 |
| 2013 | -- | $159,610 | $39,893 | $119,717 |
Source: Public Records
Map
Nearby Homes