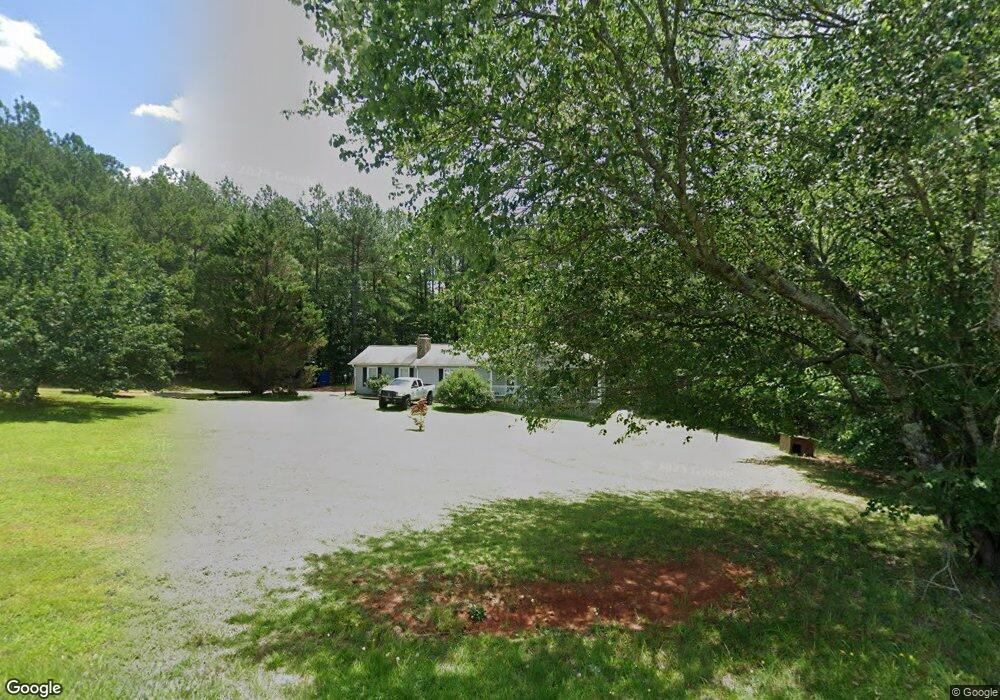
351 Allgood Bridge Rd Pickens, SC 29671
Estimated Value: $297,000 - $342,546
3
Beds
2
Baths
1,424
Sq Ft
$223/Sq Ft
Est. Value
About This Home
This home is located at 351 Allgood Bridge Rd, Pickens, SC 29671 and is currently estimated at $317,887, approximately $223 per square foot. 351 Allgood Bridge Rd is a home located in Pickens County with nearby schools including Hagood Elementary School, Pickens Middle School, and Pickens High School.
Ownership History
Date
Name
Owned For
Owner Type
Purchase Details
Closed on
May 18, 2015
Sold by
The United States Department Of Housing
Bought by
Holcombe Matthew P
Current Estimated Value
Home Financials for this Owner
Home Financials are based on the most recent Mortgage that was taken out on this home.
Original Mortgage
$137,376
Outstanding Balance
$106,098
Interest Rate
3.75%
Mortgage Type
New Conventional
Estimated Equity
$211,789
Purchase Details
Closed on
May 19, 2014
Sold by
Bank Of America Na
Bought by
The Secretary Of Housing & Urban Develop
Purchase Details
Closed on
Nov 2, 2013
Sold by
Maschek Mark T
Bought by
Bank Of America Na
Purchase Details
Closed on
Aug 24, 2006
Sold by
Masters Wallace N and Masters Bonnie D
Bought by
Maschek Mark T
Home Financials for this Owner
Home Financials are based on the most recent Mortgage that was taken out on this home.
Original Mortgage
$162,450
Interest Rate
6.67%
Mortgage Type
FHA
Create a Home Valuation Report for This Property
The Home Valuation Report is an in-depth analysis detailing your home's value as well as a comparison with similar homes in the area
Home Values in the Area
Average Home Value in this Area
Purchase History
| Date | Buyer | Sale Price | Title Company |
|---|---|---|---|
| Holcombe Matthew P | $128,000 | -- | |
| The Secretary Of Housing & Urban Develop | -- | -- | |
| Bank Of America Na | $155,910 | -- | |
| Maschek Mark T | $165,000 | None Available |
Source: Public Records
Mortgage History
| Date | Status | Borrower | Loan Amount |
|---|---|---|---|
| Open | Holcombe Matthew P | $137,376 | |
| Previous Owner | Maschek Mark T | $162,450 |
Source: Public Records
Tax History Compared to Growth
Tax History
| Year | Tax Paid | Tax Assessment Tax Assessment Total Assessment is a certain percentage of the fair market value that is determined by local assessors to be the total taxable value of land and additions on the property. | Land | Improvement |
|---|---|---|---|---|
| 2024 | $848 | $6,950 | $1,710 | $5,240 |
| 2023 | $848 | $6,950 | $1,710 | $5,240 |
| 2022 | $852 | $6,950 | $1,710 | $5,240 |
| 2021 | $814 | $6,950 | $1,710 | $5,240 |
| 2020 | $828 | $6,920 | $1,676 | $5,244 |
| 2019 | $843 | $6,950 | $1,710 | $5,240 |
| 2018 | $811 | $6,670 | $1,930 | $4,740 |
| 2017 | $786 | $6,670 | $1,930 | $4,740 |
| 2015 | $2,283 | $6,670 | $0 | $0 |
| 2008 | -- | $5,690 | $1,500 | $4,190 |
Source: Public Records
Map
Nearby Homes
- 191 Juniper Ln
- 0 Walhalla Hwy
- 214 Allgood Dr
- 220 Allgood Dr
- 109 Sycamore Ct
- 101 Shady Grove Estates
- 524 Secona Rd
- 190 Heritage Dr
- 0 State Road S-39-122
- 00 Mauldin Lake Rd
- 209 Bivens St
- 106 Bradley Dr
- 117 Enchanted Walk
- 4612 Moorefield Memorial Hwy
- 508 Johnson St
- 315 Florence St
- AUGUSTA Plan at Concord Place
- ESSEX Plan at Concord Place
- DUPONT Plan at Concord Place
- REYNOLDS Plan at Concord Place
- 359 Allgood Bridge Rd
- 403 Allgood Bridge Rd
- 315 Allgood Bridge Rd
- 411 Allgood Bridge Rd
- 308 Allgood Bridge Rd
- 300 Allgood Bridge Rd
- 373 Allgood Farm Rd
- 361 Allgood Farm Rd
- 429 Allgood Bridge Rd
- 344 Allgood Bridge Rd
- 270 Allgood Bridge Rd
- 335 Allgood Farm Rd
- 00 Allgood Bridge Rd
- 244 Allgood Bridge Rd
- 146 Hollingsworth Dr
- 234 Allgood Bridge Rd
- 476 Allgood Bridge Rd
- 319 Allgood Farm Rd
- 314 Allgood Farm Rd
- 200 Hollingsworth Dr