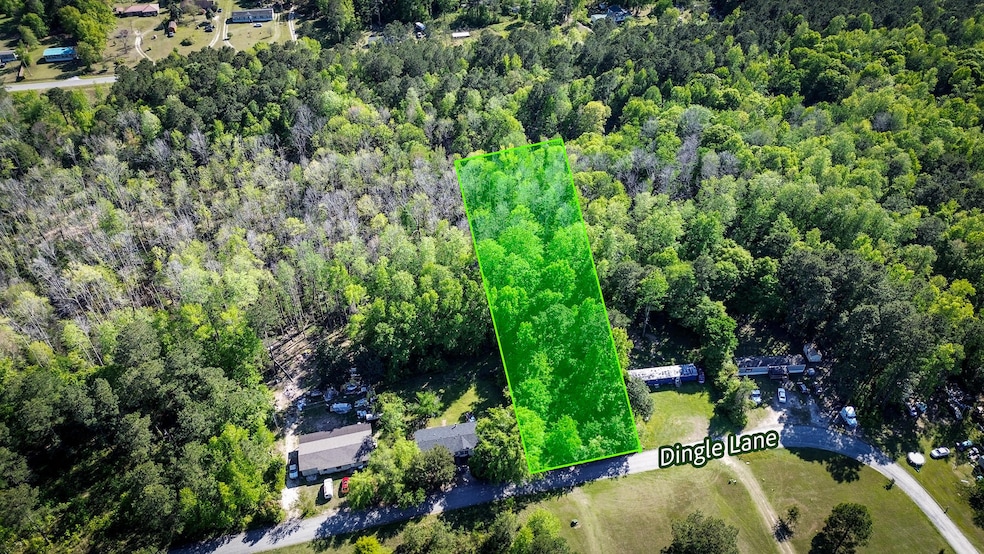
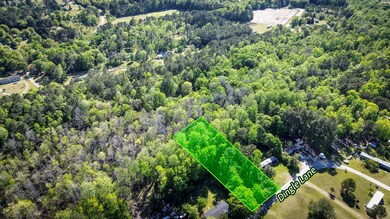

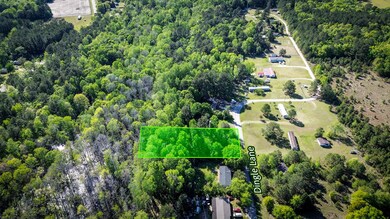
351 Dingle Ln Saint Stephen, SC 29479
Estimated payment $225/month
About This Lot
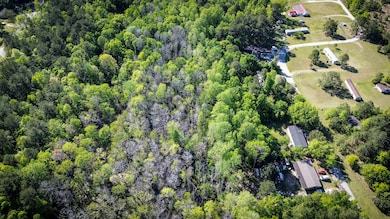
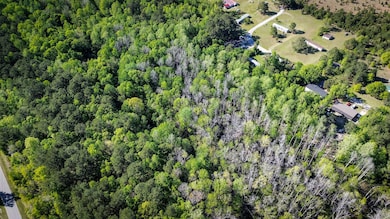
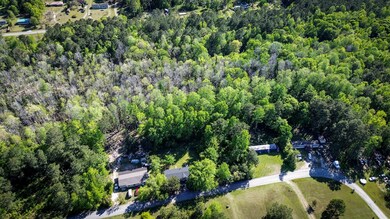
This lot was used as residential property with a mobile that was removed years ago. It is uncleared with trees and overgrown brush. There is a well and septic on the property but the power meter has been removed. The septic system inspection report is listed under ''Documents''.

Property Details
Property Type
- Land
Est. Annual Taxes
- $180
Lot Details
- 1 Acre Lot
- Dirt Road
- Wooded Lot
Schools
- St. Stephen Elementary And Middle School
- Timberland High School
Utilities
- Septic Tank
Community Details
- St. Stephen Subdivision
Listing and Financial Details
- Tax Lot 5
Map
Home Values in the Area
Average Home Value in this Area
Tax History
| Year | Tax Paid | Tax Assessment Tax Assessment Total Assessment is a certain percentage of the fair market value that is determined by local assessors to be the total taxable value of land and additions on the property. | Land | Improvement |
|---|---|---|---|---|
| 2025 | $432 | $30,000 | $30,000 | $0 |
| 2024 | $180 | $1,800 | $1,800 | $0 |
| 2023 | $180 | $724 | $724 | $0 |
| 2022 | $172 | $630 | $630 | $0 |
| 2021 | $174 | $630 | $630 | $0 |
| 2020 | $174 | $630 | $630 | $0 |
| 2019 | $174 | $630 | $630 | $0 |
| 2018 | $184 | $630 | $630 | $0 |
| 2017 | $184 | $630 | $630 | $0 |
| 2016 | $186 | $630 | $630 | $0 |
| 2015 | $177 | $630 | $630 | $0 |
| 2014 | $377 | $2,030 | $420 | $1,610 |
| 2013 | -- | $2,030 | $420 | $1,610 |
Property History
| Date | Event | Price | List to Sale | Price per Sq Ft |
|---|---|---|---|---|
| 12/01/2025 12/01/25 | Price Changed | $40,000 | -20.0% | -- |
| 04/15/2025 04/15/25 | For Sale | $50,000 | -- | -- |
Purchase History
| Date | Type | Sale Price | Title Company |
|---|---|---|---|
| Quit Claim Deed | -- | None Listed On Document | |
| Quit Claim Deed | -- | None Listed On Document |
Source: CHS Regional MLS
MLS Number: 25010403
APN: 036-00-01-049
Disclaimer: Certain information contained herein is derived from information provided by parties other than Homes.com. All information provided is deemed reliable, but is not guaranteed to be accurate and should be independently verified.
![]() The information is being provided by Charleston Trident MLS. Information deemed reliable but not guaranteed. Information is provided for consumers' personal, non-commercial use, and may not be used for any purpose other than the identification of potential properties for purchase. © 2026 Charleston Trident MLS. All Rights Reserved
The information is being provided by Charleston Trident MLS. Information deemed reliable but not guaranteed. Information is provided for consumers' personal, non-commercial use, and may not be used for any purpose other than the identification of potential properties for purchase. © 2026 Charleston Trident MLS. All Rights Reserved
- 325 Beulah Tabernacle Dr
- 408 Beulah Tabernacle Dr
- 3292 N Highway 52
- 0 Peppermill Way
- 6 Highway 52
- 1 Highway 52
- 940 Fauling Rd
- 909 Fauling Rd
- 288 Tiger Lily Ln
- 964 Tiger Loop
- Tract 3 Chauncey Ln
- 0 Trinity Church Unit 26002784
- 297 Tiger Lily Ln
- 1364 Highway 35
- 948 S Main St
- 1225 Old Mill Rd
- Lot 7 Wisteria Falls Trail
- 1474 Mandella Rd
- 1085 Tobacco Rd
- 2896 Harristown Rd
- 106 M L King Junior Blvd Unit A
- 547 Reid Hill Rd
- 410 Wright Rd A
- 2000 Epson Plantation Dr
- 204 Hutchinson Ln
- 108 Fairground Rd
- 1034 Pinopolis Rd
- 136 Orion Way
- 108 Haynesville Rd
- 111 Orchid Bloom Cir
- 113 Gospel Ln Unit A
- 1101 Stuart Dr
- 121 Marigny St
- 121 Marigny St Unit Crepe Myrtle
- 121 Marigny St Unit Live Oak
- 121 Marigny St Unit Magnolia
- 411 Grove End Rd
- 107 Orchid Bloom Cir
- 337 Lakewind Dr
- 1226 State Rd S-8-806 Unit A
Ask me questions while you tour the home.