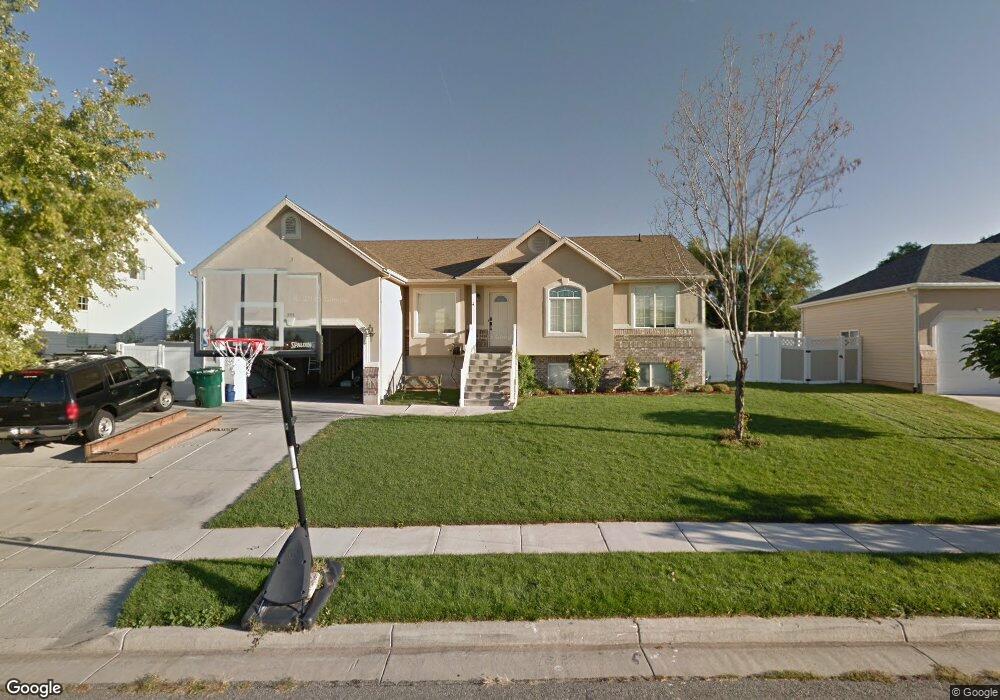
351 E 1625 N Layton, UT 84041
Estimated Value: $555,000 - $609,000
6
Beds
3
Baths
2,985
Sq Ft
$196/Sq Ft
Est. Value
About This Home
This home is located at 351 E 1625 N, Layton, UT 84041 and is currently estimated at $583,691, approximately $195 per square foot. 351 E 1625 N is a home located in Davis County with nearby schools including Lincoln Elementary School, North Layton Junior High School, and Northridge High School.
Ownership History
Date
Name
Owned For
Owner Type
Purchase Details
Closed on
Apr 17, 2014
Sold by
Bailey Kim
Bought by
Ernst Jarrod and Ernst Christina
Current Estimated Value
Home Financials for this Owner
Home Financials are based on the most recent Mortgage that was taken out on this home.
Original Mortgage
$250,381
Outstanding Balance
$189,129
Interest Rate
4.25%
Mortgage Type
FHA
Estimated Equity
$394,562
Purchase Details
Closed on
Aug 30, 2013
Sold by
Malley Shawn M O
Bought by
Bailey Kim
Purchase Details
Closed on
Oct 18, 2010
Sold by
Omalley Kyri
Bought by
Omalley Shawn M
Home Financials for this Owner
Home Financials are based on the most recent Mortgage that was taken out on this home.
Original Mortgage
$273,886
Interest Rate
4.5%
Mortgage Type
FHA
Purchase Details
Closed on
Mar 25, 2009
Sold by
Omalley Shawn M
Bought by
Omalley Shawn M and Omalley Kyri
Home Financials for this Owner
Home Financials are based on the most recent Mortgage that was taken out on this home.
Original Mortgage
$273,779
Interest Rate
5.15%
Mortgage Type
FHA
Purchase Details
Closed on
Apr 12, 2007
Sold by
Auger Leslie and Auger Charles P
Bought by
Omalley Shawn M
Home Financials for this Owner
Home Financials are based on the most recent Mortgage that was taken out on this home.
Original Mortgage
$64,250
Interest Rate
5.86%
Mortgage Type
Stand Alone Second
Purchase Details
Closed on
Mar 17, 2006
Sold by
Christensen Leslie A and Auger Charles P
Bought by
Auger Leslie and Auger Charles P
Home Financials for this Owner
Home Financials are based on the most recent Mortgage that was taken out on this home.
Original Mortgage
$176,000
Interest Rate
6.18%
Mortgage Type
New Conventional
Purchase Details
Closed on
Apr 20, 2004
Sold by
Christensen Mathew A
Bought by
Christensen Leslie A and Auger Charles P
Home Financials for this Owner
Home Financials are based on the most recent Mortgage that was taken out on this home.
Original Mortgage
$90,000
Interest Rate
5.39%
Mortgage Type
New Conventional
Purchase Details
Closed on
Oct 29, 2001
Sold by
Perry Homes Inc
Bought by
Christensen Mathew A and Christensen Leslie A
Home Financials for this Owner
Home Financials are based on the most recent Mortgage that was taken out on this home.
Original Mortgage
$158,035
Interest Rate
6.87%
Mortgage Type
FHA
Create a Home Valuation Report for This Property
The Home Valuation Report is an in-depth analysis detailing your home's value as well as a comparison with similar homes in the area
Home Values in the Area
Average Home Value in this Area
Purchase History
| Date | Buyer | Sale Price | Title Company |
|---|---|---|---|
| Ernst Jarrod | -- | Metro National Title | |
| Bailey Kim | -- | Security Title Of David Coun | |
| Omalley Shawn M | -- | Bonneville Superior Title | |
| Omalley Shawn M | -- | Bonneville Superior Title C | |
| Omalley Shawn M | -- | Equity Title Ins Agency Inc | |
| Omalley Shawn M | -- | Equity Title Ins Agency Inc | |
| Auger Leslie | -- | Equity Title Ins Agency Inc | |
| Christensen Leslie A | -- | Bonneville Title Company Inc | |
| Christensen Mathew A | -- | Meridian Title Company | |
| Perry Homes Inc | -- | Meridian Title Company |
Source: Public Records
Mortgage History
| Date | Status | Borrower | Loan Amount |
|---|---|---|---|
| Open | Ernst Jarrod | $250,381 | |
| Previous Owner | Omalley Shawn M | $273,886 | |
| Previous Owner | Omalley Shawn M | $273,779 | |
| Previous Owner | Omalley Shawn M | $64,250 | |
| Previous Owner | Omalley Shawn M | $192,750 | |
| Previous Owner | Auger Leslie | $176,000 | |
| Previous Owner | Christensen Leslie A | $90,000 | |
| Previous Owner | Christensen Mathew A | $158,035 |
Source: Public Records
Tax History
| Year | Tax Paid | Tax Assessment Tax Assessment Total Assessment is a certain percentage of the fair market value that is determined by local assessors to be the total taxable value of land and additions on the property. | Land | Improvement |
|---|---|---|---|---|
| 2025 | $2,625 | $275,550 | $100,388 | $175,162 |
| 2024 | $2,507 | $265,100 | $117,069 | $148,031 |
| 2023 | $2,516 | $469,000 | $140,080 | $328,920 |
| 2022 | $2,636 | $266,751 | $73,794 | $192,957 |
| 2021 | $2,445 | $369,000 | $102,802 | $266,198 |
| 2020 | $2,341 | $339,000 | $86,798 | $252,202 |
| 2019 | $2,298 | $326,000 | $82,711 | $243,289 |
| 2018 | $2,086 | $297,000 | $82,711 | $214,289 |
| 2016 | $1,955 | $143,605 | $26,232 | $117,373 |
| 2015 | $1,868 | $130,240 | $26,232 | $104,008 |
| 2014 | $1,859 | $132,534 | $26,232 | $106,302 |
| 2013 | -- | $123,373 | $33,088 | $90,285 |
Source: Public Records
Map
Nearby Homes
Your Personal Tour Guide
Ask me questions while you tour the home.