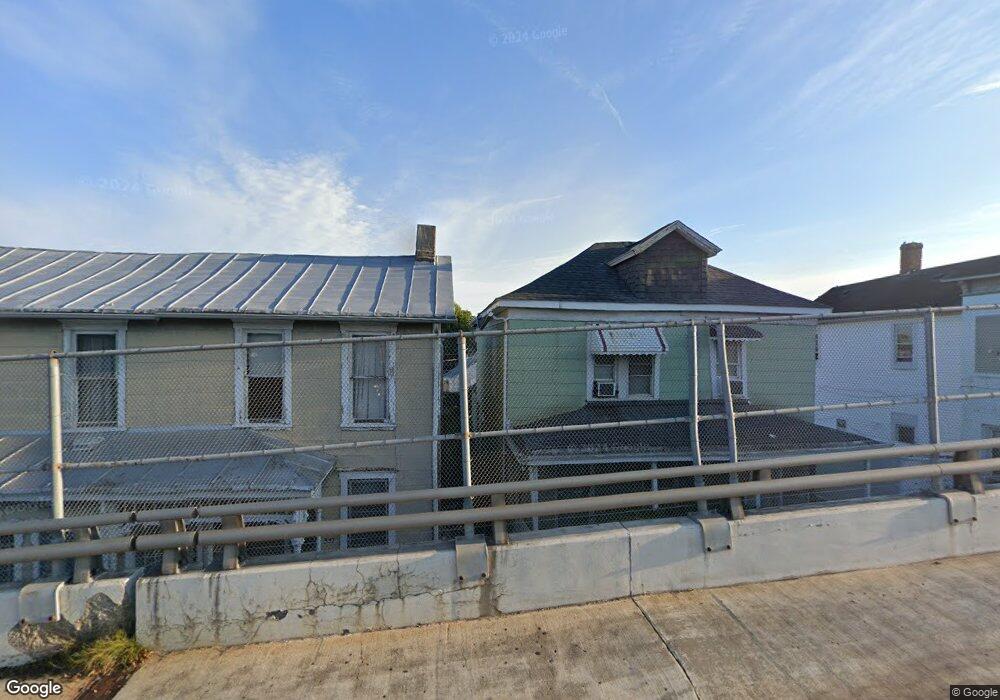
351 E Main St Chillicothe, OH 45601
Estimated Value: $168,000 - $215,000
Studio
--
Bath
4,156
Sq Ft
$45/Sq Ft
Est. Value
About This Home
This home is located at 351 E Main St, Chillicothe, OH 45601 and is currently estimated at $186,333, approximately $44 per square foot. 351 E Main St is a home located in Ross County with nearby schools including Chillicothe High School, Bishop Flaget School, and Wesley Taylor Preparatory School.
Ownership History
Date
Name
Owned For
Owner Type
Purchase Details
Closed on
Jan 31, 2020
Sold by
Adams Jerry C and Adams Debbie J
Bought by
Aquino & King S Llc
Current Estimated Value
Home Financials for this Owner
Home Financials are based on the most recent Mortgage that was taken out on this home.
Original Mortgage
$89,600
Outstanding Balance
$79,545
Interest Rate
3.74%
Mortgage Type
Future Advance Clause Open End Mortgage
Estimated Equity
$106,788
Purchase Details
Closed on
Oct 4, 2011
Sold by
Adams Henry C
Bought by
Adams Jerry C and Adams Debbie J
Create a Home Valuation Report for This Property
The Home Valuation Report is an in-depth analysis detailing your home's value as well as a comparison with similar homes in the area
Home Values in the Area
Average Home Value in this Area
Purchase History
| Date | Buyer | Sale Price | Title Company |
|---|---|---|---|
| Aquino & King S Llc | $112,000 | None Available | |
| Adams Jerry C | -- | Attorney |
Source: Public Records
Mortgage History
| Date | Status | Borrower | Loan Amount |
|---|---|---|---|
| Open | Aquino & King S Llc | $89,600 |
Source: Public Records
Tax History
| Year | Tax Paid | Tax Assessment Tax Assessment Total Assessment is a certain percentage of the fair market value that is determined by local assessors to be the total taxable value of land and additions on the property. | Land | Improvement |
|---|---|---|---|---|
| 2024 | $983 | $26,390 | $6,030 | $20,360 |
| 2023 | $983 | $24,100 | $6,030 | $18,070 |
| 2022 | $1,001 | $24,100 | $6,030 | $18,070 |
| 2021 | $1,096 | $23,140 | $5,230 | $17,910 |
| 2020 | $1,096 | $23,140 | $5,230 | $17,910 |
| 2019 | $1,097 | $23,140 | $5,230 | $17,910 |
| 2018 | $987 | $19,720 | $5,230 | $14,490 |
| 2017 | $1,063 | $19,720 | $5,230 | $14,490 |
| 2016 | $1,053 | $19,720 | $5,230 | $14,490 |
| 2015 | $989 | $18,080 | $5,230 | $12,850 |
| 2014 | $971 | $18,080 | $5,230 | $12,850 |
| 2013 | $972 | $18,080 | $5,230 | $12,850 |
Source: Public Records
Map
Nearby Homes
Your Personal Tour Guide
Ask me questions while you tour the home.