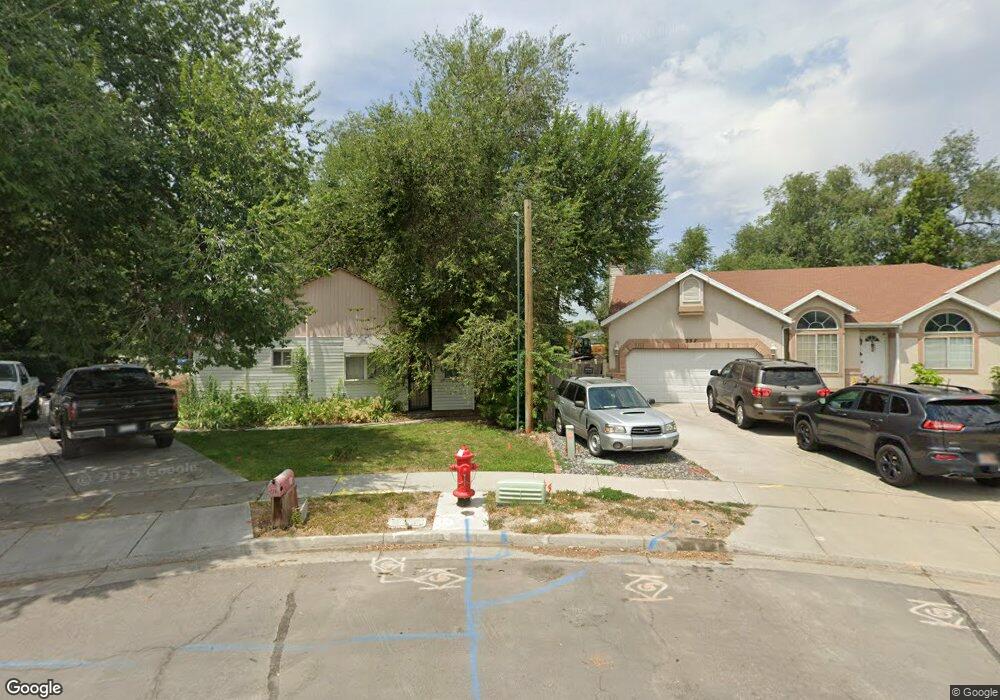
351 E Sandy Park Cir Midvale, UT 84047
Estimated Value: $408,937 - $537,000
2
Beds
1
Bath
1,300
Sq Ft
$355/Sq Ft
Est. Value
About This Home
This home is located at 351 E Sandy Park Cir, Midvale, UT 84047 and is currently estimated at $461,734, approximately $355 per square foot. 351 E Sandy Park Cir is a home located in Salt Lake County with nearby schools including Midvalley Elementary School, Union Middle School, and Hillcrest High School.
Ownership History
Date
Name
Owned For
Owner Type
Purchase Details
Closed on
Dec 30, 2014
Sold by
Max Development Llc
Bought by
Curtis Arlene J and Curtis Gary C
Current Estimated Value
Purchase Details
Closed on
Jun 6, 2014
Sold by
Maxfield Roger and Maxfield Linda
Bought by
Max Development Llc
Purchase Details
Closed on
Jan 6, 2014
Sold by
Maxfield Nathan R and Maxfield Janet S
Bought by
Maxfield Roger and Maxfield Linda
Purchase Details
Closed on
Dec 27, 2013
Sold by
Maxfield Nathan R and Maxfield Janet S
Bought by
Maxfield Roger and Maxfield Linda
Purchase Details
Closed on
Dec 4, 2009
Sold by
Maxfield Nathan R
Bought by
Sandy Woods Park Subdivision Lc
Home Financials for this Owner
Home Financials are based on the most recent Mortgage that was taken out on this home.
Original Mortgage
$39,300
Interest Rate
4.99%
Mortgage Type
New Conventional
Create a Home Valuation Report for This Property
The Home Valuation Report is an in-depth analysis detailing your home's value as well as a comparison with similar homes in the area
Home Values in the Area
Average Home Value in this Area
Purchase History
| Date | Buyer | Sale Price | Title Company |
|---|---|---|---|
| Curtis Arlene J | -- | Cottonwood Title | |
| Max Development Llc | -- | None Available | |
| Maxfield Roger | -- | None Available | |
| Maxfield Roger | -- | None Available | |
| Maxfield Nathan R | -- | None Available | |
| Maxfield Nathan R | -- | None Available | |
| Sandy Woods Park Subdivision Lc | -- | First American Title | |
| Maxfield Nathan R | -- | First American Title |
Source: Public Records
Mortgage History
| Date | Status | Borrower | Loan Amount |
|---|---|---|---|
| Previous Owner | Maxfield Nathan R | $39,300 |
Source: Public Records
Tax History
| Year | Tax Paid | Tax Assessment Tax Assessment Total Assessment is a certain percentage of the fair market value that is determined by local assessors to be the total taxable value of land and additions on the property. | Land | Improvement |
|---|---|---|---|---|
| 2025 | -- | $316,200 | $170,000 | $146,200 |
| 2024 | -- | $308,200 | $154,600 | $153,600 |
| 2023 | $1,361 | $236,800 | $146,900 | $89,900 |
| 2022 | $1,361 | $245,200 | $144,000 | $101,200 |
| 2021 | $1,222 | $187,000 | $136,300 | $50,700 |
| 2020 | $1,172 | $169,300 | $119,000 | $50,300 |
| 2019 | $1,246 | $175,200 | $112,300 | $62,900 |
| 2016 | $999 | $131,500 | $112,300 | $19,200 |
Source: Public Records
Map
Nearby Homes
- 7613 S 300 E
- 330 E 7635 S Unit 344
- 350 E 7635 South St
- 354 E 7635 South St
- 7359 S Dewmar Ct W Unit 32
- 489 E 7800 S Unit 2
- 7363 S Dewmar Ct W Unit 33
- 7342 S Seven Tree Ln W Unit 77
- 7329 S Seven Tree Ln W Unit 85
- 7371 S Dewmar Ct W Unit 35
- 7327 S Seven Tree Ln W Unit 86
- 7337 S Seven Tree Ln W Unit 82
- 7343 S Seven Tree Ln Unit 79
- 7355 S Dewmar Ct W Unit 31
- 220 E Greenwood Ave
- 7579 S 520 E
- 7824 S 280 E
- 7432 Green Berry Ct
- 397 E Tractor Dr Unit 103
- 110 Greenwood Ave
- 351 Sandy Park Cir
- 357 Sandy Park Cir
- 357 E Sandy Park Cir
- 354 Sandy Park Cir
- 360 Sandy Park Cir
- 360 E 7635 S
- 366 Sandy Park Cir
- 365 Sandy Park Cir
- 374 E Sandy Park Cir
- 373 Sandy Park Cir
- 373 E Sandy Park Cir
- 374 Sandy Park Cir
- 374 E Sandy Park Cir
- 352 E Sandy Woods Ln
- 352 Sandy Woods Ln
- 351 E 7670 S Unit 353
- 342 E Sandy Woods Ln
- 342 Sandy Woods Ln
- 7633 S 300 E
- 339 E 7670 S Unit 341
Your Personal Tour Guide
Ask me questions while you tour the home.