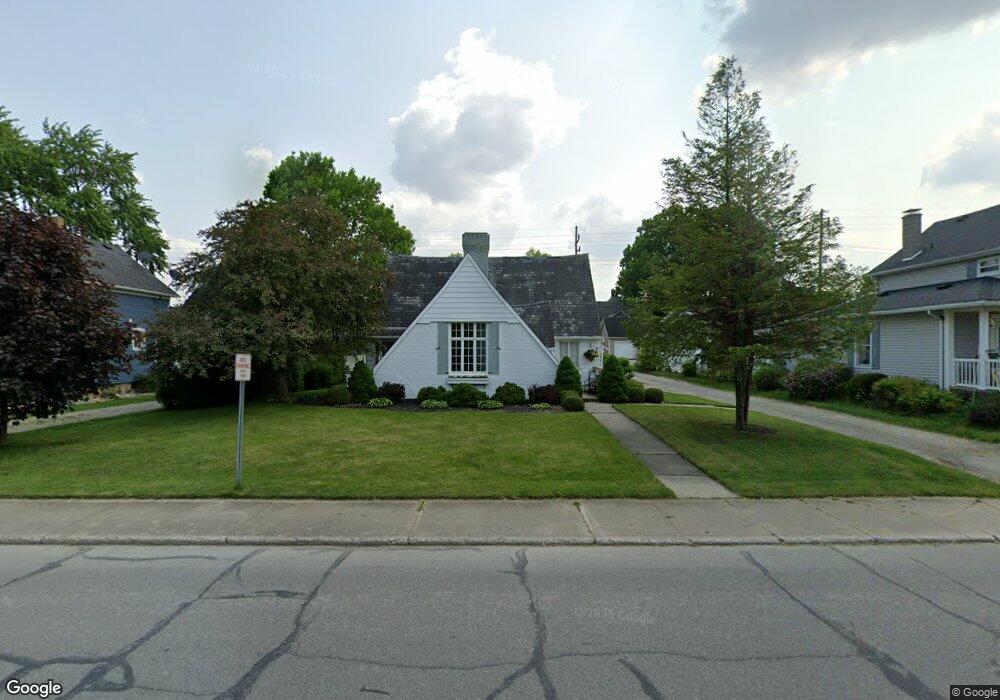
351 E Walnut St Nappanee, IN 46550
Estimated Value: $196,000 - $241,000
3
Beds
2
Baths
1,870
Sq Ft
$117/Sq Ft
Est. Value
About This Home
This home is located at 351 E Walnut St, Nappanee, IN 46550 and is currently estimated at $218,386, approximately $116 per square foot. 351 E Walnut St is a home located in Elkhart County with nearby schools including NorthWood High School, South Side Christian School, and Sunny Meadow Amish School.
Ownership History
Date
Name
Owned For
Owner Type
Purchase Details
Closed on
Aug 5, 2016
Sold by
Mast Krik R and Mast Alexis A
Bought by
Veenstra Timothy D and Veenstra Kelbi C
Current Estimated Value
Home Financials for this Owner
Home Financials are based on the most recent Mortgage that was taken out on this home.
Original Mortgage
$138,710
Outstanding Balance
$109,515
Interest Rate
3.41%
Mortgage Type
New Conventional
Estimated Equity
$108,871
Purchase Details
Closed on
Mar 31, 2015
Sold by
Mast Kirk R and Mast Alexis A
Bought by
Mast Kirk R and Mast Alexis A
Home Financials for this Owner
Home Financials are based on the most recent Mortgage that was taken out on this home.
Original Mortgage
$108,800
Interest Rate
3.73%
Mortgage Type
New Conventional
Purchase Details
Closed on
Jun 29, 2007
Sold by
Johnson William A and Johnson Betty E
Bought by
Mast Kirk R and Honeycutt Alexis A
Home Financials for this Owner
Home Financials are based on the most recent Mortgage that was taken out on this home.
Original Mortgage
$112,900
Interest Rate
6.42%
Mortgage Type
Purchase Money Mortgage
Create a Home Valuation Report for This Property
The Home Valuation Report is an in-depth analysis detailing your home's value as well as a comparison with similar homes in the area
Home Values in the Area
Average Home Value in this Area
Purchase History
| Date | Buyer | Sale Price | Title Company |
|---|---|---|---|
| Veenstra Timothy D | -- | Hamilton Title | |
| Mast Kirk R | -- | Hamilton National Title Llc | |
| Mast Kirk R | -- | Stewart Title |
Source: Public Records
Mortgage History
| Date | Status | Borrower | Loan Amount |
|---|---|---|---|
| Open | Veenstra Timothy D | $138,710 | |
| Previous Owner | Mast Kirk R | $108,800 | |
| Previous Owner | Mast Kirk R | $112,900 |
Source: Public Records
Tax History
| Year | Tax Paid | Tax Assessment Tax Assessment Total Assessment is a certain percentage of the fair market value that is determined by local assessors to be the total taxable value of land and additions on the property. | Land | Improvement |
|---|---|---|---|---|
| 2025 | $1,808 | $196,300 | $23,100 | $173,200 |
| 2024 | $1,691 | $176,500 | $23,100 | $153,400 |
| 2022 | $1,691 | $155,800 | $23,100 | $132,700 |
| 2021 | $1,597 | $154,500 | $23,100 | $131,400 |
| 2020 | $1,468 | $142,100 | $23,100 | $119,000 |
| 2019 | $1,401 | $135,600 | $23,100 | $112,500 |
| 2018 | $1,284 | $124,300 | $21,100 | $103,200 |
| 2017 | $1,141 | $114,100 | $21,100 | $93,000 |
| 2016 | $1,108 | $110,800 | $21,100 | $89,700 |
| 2014 | $1,020 | $102,000 | $21,100 | $80,900 |
| 2013 | $996 | $99,600 | $21,100 | $78,500 |
Source: Public Records
Map
Nearby Homes
- 608 E Lincoln St
- 556 Broad Ave
- 152 N Nappanee St
- 1058 E Market St
- 555 W Market St
- 656 W Market St
- 525 Miller's Ct
- 401 W Indiana Ave
- 754 W Market St
- 1307 Penny Ln
- 507 Buffalo Ct
- 324 Wellfield Dr Unit Lot 84
- 346 Wellfield Dr
- 302 E Woodview Dr
- 72355 County Road 3
- 1946 Country Cir S
- 652 Bungalow Dr
- 2257 Prairie Ln
- 70857 Tecumseh Dr
- 72192 County Road 9
- 154 Hartman Walnut Ct
- 152 N Hartman St
- 307 E Walnut St
- 352 E Market St
- 151 N Madison St
- 301 E Walnut St
- 356 E Market St
- 308 E Market St
- 352 E Walnut St
- 302 E Market St
- 308 E Walnut St
- 103 N Hartman St
- 153 N Hartman St
- 201 N Madison St
- 402 E Market St
- 402 E Walnut St
- 404 E Market St
- 258 E Market St
- 152 N Madison St
- 158 N Madison St
Your Personal Tour Guide
Ask me questions while you tour the home.