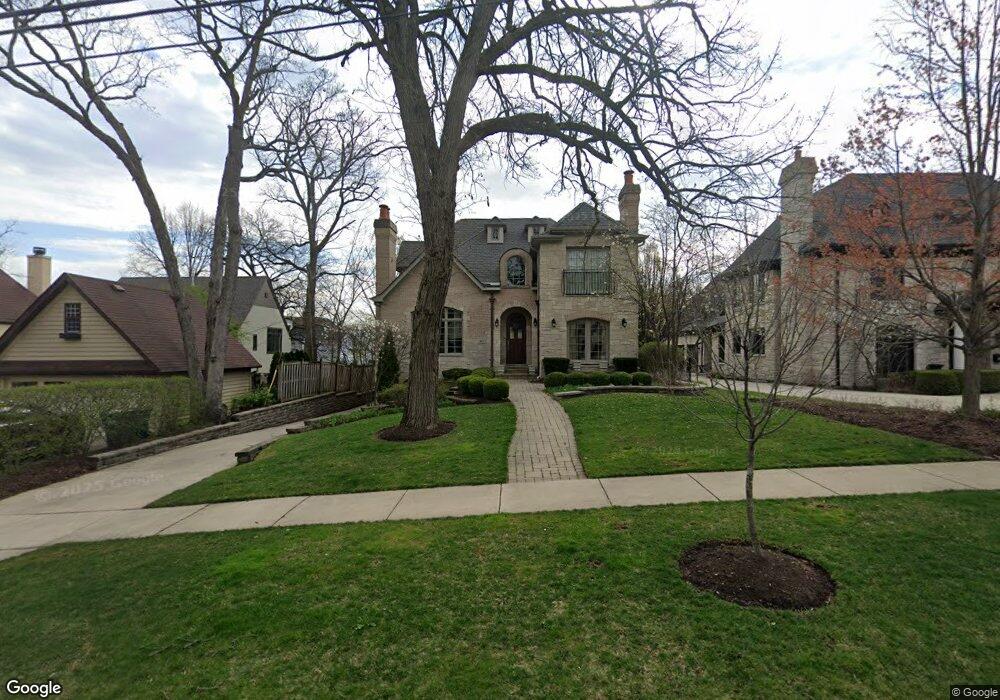
351 Forest Rd Hinsdale, IL 60521
North Hinsdale NeighborhoodEstimated Value: $2,083,314 - $2,246,000
4
Beds
6
Baths
4,019
Sq Ft
$545/Sq Ft
Est. Value
About This Home
This home is located at 351 Forest Rd, Hinsdale, IL 60521 and is currently estimated at $2,189,105, approximately $544 per square foot. 351 Forest Rd is a home located in DuPage County with nearby schools including The Lane Elementary School, Hinsdale Middle School, and Hinsdale Central High School.
Ownership History
Date
Name
Owned For
Owner Type
Purchase Details
Closed on
Sep 6, 2006
Sold by
Walker Gordon A and Walker Amy A
Bought by
Downers Grove National Bank and Trust #06-044
Current Estimated Value
Purchase Details
Closed on
Feb 5, 2004
Sold by
Heydenberk David D and Heydenberk Constance R
Bought by
Walker Gordon A and Walker Amy A
Home Financials for this Owner
Home Financials are based on the most recent Mortgage that was taken out on this home.
Original Mortgage
$200,000
Interest Rate
5.91%
Mortgage Type
Purchase Money Mortgage
Purchase Details
Closed on
Oct 19, 2001
Sold by
Southard Michael R
Bought by
Heydenberk David D and Heydenberk Constance R
Home Financials for this Owner
Home Financials are based on the most recent Mortgage that was taken out on this home.
Original Mortgage
$230,000
Interest Rate
6.88%
Purchase Details
Closed on
Mar 20, 2001
Sold by
Dutton William M and Dutton Joan H
Bought by
Southard Michael R and Southard Audrey M
Create a Home Valuation Report for This Property
The Home Valuation Report is an in-depth analysis detailing your home's value as well as a comparison with similar homes in the area
Home Values in the Area
Average Home Value in this Area
Purchase History
| Date | Buyer | Sale Price | Title Company |
|---|---|---|---|
| Downers Grove National Bank | $2,000,000 | Ctic Dupage | |
| Walker Gordon A | $1,825,000 | Premier Title | |
| Heydenberk David D | $600,000 | -- | |
| Southard Michael R | $620,000 | -- |
Source: Public Records
Mortgage History
| Date | Status | Borrower | Loan Amount |
|---|---|---|---|
| Previous Owner | Walker Gordon A | $200,000 | |
| Previous Owner | Heydenberk David D | $230,000 |
Source: Public Records
Tax History Compared to Growth
Tax History
| Year | Tax Paid | Tax Assessment Tax Assessment Total Assessment is a certain percentage of the fair market value that is determined by local assessors to be the total taxable value of land and additions on the property. | Land | Improvement |
|---|---|---|---|---|
| 2024 | $30,967 | $605,339 | $113,936 | $491,403 |
| 2023 | $29,458 | $556,480 | $104,740 | $451,740 |
| 2022 | $29,276 | $564,400 | $106,240 | $458,160 |
| 2021 | $28,212 | $557,980 | $105,030 | $452,950 |
| 2020 | $27,575 | $546,930 | $102,950 | $443,980 |
| 2019 | $27,160 | $524,780 | $98,780 | $426,000 |
| 2018 | $26,724 | $534,970 | $98,270 | $436,700 |
| 2017 | $25,762 | $514,790 | $94,560 | $420,230 |
| 2016 | $25,276 | $491,310 | $90,250 | $401,060 |
| 2015 | $24,943 | $450,990 | $84,910 | $366,080 |
| 2014 | $23,594 | $412,130 | $82,560 | $329,570 |
| 2013 | $23,134 | $410,200 | $82,170 | $328,030 |
Source: Public Records
Map
Nearby Homes
- 531 N York Rd
- 317 E Walnut St
- 329 N Oak St
- 437 N County Line Rd
- 719 N Elm St
- 6 S Elm St
- 3 Orchard Place
- 13 S Elm St
- 625 N County Line Rd
- 422 Mills St
- 210 W Hickory St
- 510 Mills St
- 118 N Grant St
- 735 Phillippa St
- 216 Bonnie Brae Rd
- 123 N Vine St
- 11S110 LOT Madison St
- 1526 Walnut St
- 133 S Park Ave
- 327 Bonnie Brae Rd