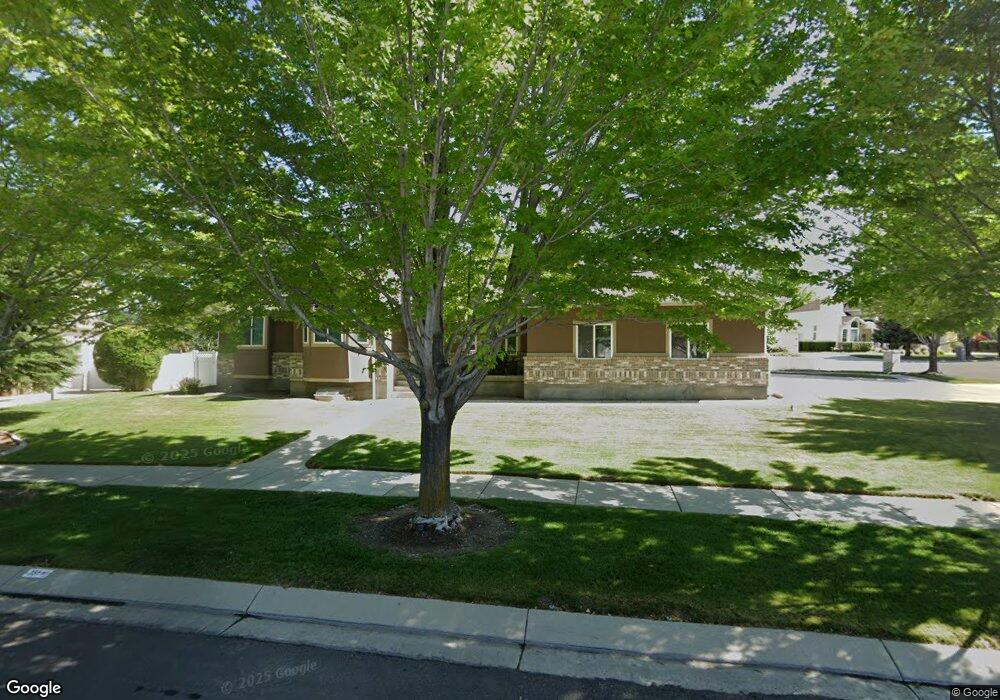
351 High Berry Ln Draper, UT 84020
Estimated Value: $807,000 - $1,008,000
6
Beds
4
Baths
3,729
Sq Ft
$241/Sq Ft
Est. Value
About This Home
This home is located at 351 High Berry Ln, Draper, UT 84020 and is currently estimated at $899,852, approximately $241 per square foot. 351 High Berry Ln is a home located in Salt Lake County with nearby schools including Crescent School, Mount Jordan Middle School, and St John the Baptist Catholic Elementary School.
Ownership History
Date
Name
Owned For
Owner Type
Purchase Details
Closed on
Jul 1, 2024
Sold by
Oleson Family Trust and Oleson Gary R
Bought by
Roach Family Trust and Roach
Current Estimated Value
Purchase Details
Closed on
Jan 11, 2014
Sold by
Oleson Gary R
Bought by
The Oleson Family Trust and Oleson Connie L
Purchase Details
Closed on
Dec 3, 2004
Sold by
Oleson Gary R and Oleson Connie L
Bought by
Oleson Gary R
Purchase Details
Closed on
Mar 28, 1997
Sold by
J And J & Sons Construction Company
Bought by
Oleson Gary R and Oleson Connie L
Purchase Details
Closed on
Dec 26, 1996
Sold by
J And J & Sons Construction Company
Bought by
J And J & Sons Construction Inc
Home Financials for this Owner
Home Financials are based on the most recent Mortgage that was taken out on this home.
Original Mortgage
$112,000
Interest Rate
7.59%
Create a Home Valuation Report for This Property
The Home Valuation Report is an in-depth analysis detailing your home's value as well as a comparison with similar homes in the area
Home Values in the Area
Average Home Value in this Area
Purchase History
| Date | Buyer | Sale Price | Title Company |
|---|---|---|---|
| Roach Family Trust | -- | Highland Title | |
| The Oleson Family Trust | -- | Richland Title Ins Agency In | |
| Oleson Gary R | -- | -- | |
| Oleson Gary R | -- | First American Title | |
| J And J & Sons Construction Inc | -- | First American Title |
Source: Public Records
Mortgage History
| Date | Status | Borrower | Loan Amount |
|---|---|---|---|
| Previous Owner | J And J & Sons Construction Inc | $112,000 |
Source: Public Records
Tax History
| Year | Tax Paid | Tax Assessment Tax Assessment Total Assessment is a certain percentage of the fair market value that is determined by local assessors to be the total taxable value of land and additions on the property. | Land | Improvement |
|---|---|---|---|---|
| 2025 | $1,618 | $866,700 | $244,000 | $622,700 |
| 2024 | $1,618 | $720,500 | $235,000 | $485,500 |
| 2023 | $562 | $706,500 | $229,500 | $477,000 |
| 2022 | $562 | $720,900 | $225,000 | $495,900 |
| 2021 | $150 | $528,200 | $212,000 | $316,200 |
| 2020 | $3,236 | $478,700 | $186,000 | $292,700 |
| 2019 | $190 | $472,400 | $186,000 | $286,400 |
| 2016 | $222 | $401,800 | $170,000 | $231,800 |
Source: Public Records
Map
Nearby Homes
- 392 Cranberry Hill Dr
- 414 Cranberry Hill Dr
- 11544 Olive Berry Ln
- 276 E Hidden View Dr Unit 98
- 272 Hidden View Dr Unit 97
- 262 Hidden View Dr Unit 94
- 11873 Cottage View Ln
- 604 Normandy Loop Ln
- 654 Wyngate Pointe Ln
- 186 E Kimballfield Ln
- 93 Cranberry Hill Dr
- 11309 Jordan Meadow Ln Unit 199
- 11948 Cottage View Ln
- 11290 S 265 E Unit 212
- 11362 S Crescent Park Cir Unit 8
- 244 E Crescent Pkwy S Unit 206
- 11265 S Crescent Park Cir
- 11243 Hidden View Dr Unit 122
- 11344 S Abbotts Ford Ln
- 11228 S Jordan View Dr Unit 27
- 11665 Clear Berry Cir
- 365 E Clear Berry Cir
- 365 Clear Berry Cir
- 339 E High Berry Ln
- 339 High Berry Ln
- 352 High Berry Ln
- 352 E High Berry Ln
- 373 Clear Berry Cir
- 373 E Clear Berry Cir
- 338 High Berry Ln
- 338 E High Berry Ln
- 346 Mountain Berry Dr
- 327 High Berry Ln
- 334 Mountain Berry Dr
- 364 High Berry Ln
- 364 E High Berry Ln
- 362 E Mountain Berry Dr
- 362 Mountain Berry Dr
- 322 Mountain Berry Dr
- 322 E Mountain Berry Dr
Your Personal Tour Guide
Ask me questions while you tour the home.