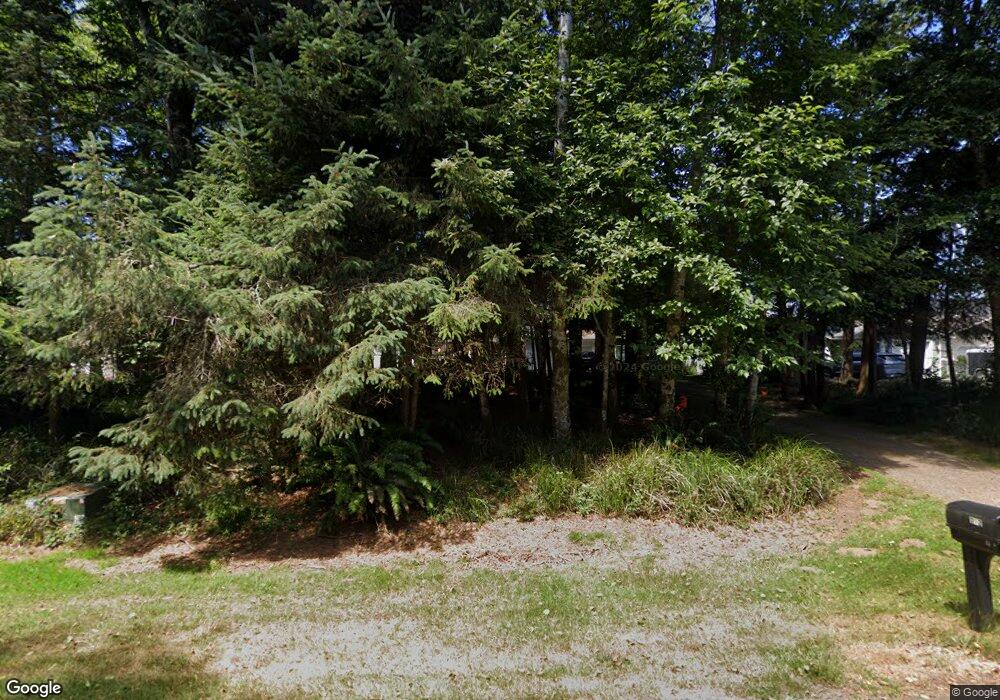
351 Lakeview Loop NE Ocean Shores, WA 98569
Estimated Value: $394,000 - $546,000
2
Beds
2
Baths
1,208
Sq Ft
$375/Sq Ft
Est. Value
About This Home
This home is located at 351 Lakeview Loop NE, Ocean Shores, WA 98569 and is currently estimated at $453,542, approximately $375 per square foot. 351 Lakeview Loop NE is a home located in Grays Harbor County with nearby schools including North Beach Junior/Senior High School.
Ownership History
Date
Name
Owned For
Owner Type
Purchase Details
Closed on
Sep 10, 2020
Sold by
Shaver Cody James T and Shaver Vicki M
Bought by
Rivera Jerry Richard and Shaver Pamala Jean
Current Estimated Value
Home Financials for this Owner
Home Financials are based on the most recent Mortgage that was taken out on this home.
Original Mortgage
$176,000
Outstanding Balance
$156,896
Interest Rate
2.9%
Mortgage Type
New Conventional
Estimated Equity
$328,898
Purchase Details
Closed on
Aug 17, 2018
Sold by
Green Lisa E
Bought by
Rivera Jerry Richard and Shaver Pamala Jean
Home Financials for this Owner
Home Financials are based on the most recent Mortgage that was taken out on this home.
Original Mortgage
$171,750
Interest Rate
4.5%
Mortgage Type
New Conventional
Purchase Details
Closed on
Oct 15, 2009
Sold by
Green Grant S
Bought by
Pate Lisa E Trust
Purchase Details
Closed on
Feb 23, 2006
Sold by
Bailey Lynn
Bought by
Green Grant and Pate Lisa E
Create a Home Valuation Report for This Property
The Home Valuation Report is an in-depth analysis detailing your home's value as well as a comparison with similar homes in the area
Home Values in the Area
Average Home Value in this Area
Purchase History
| Date | Buyer | Sale Price | Title Company |
|---|---|---|---|
| Rivera Jerry Richard | -- | Coast Title | |
| Rivera Jerry Richard | $229,000 | Coast Title | |
| Pate Lisa E Trust | -- | None Available | |
| Green Grant | $269,000 | Coast Title |
Source: Public Records
Mortgage History
| Date | Status | Borrower | Loan Amount |
|---|---|---|---|
| Open | Rivera Jerry Richard | $176,000 | |
| Closed | Rivera Jerry Richard | $171,750 |
Source: Public Records
Tax History Compared to Growth
Tax History
| Year | Tax Paid | Tax Assessment Tax Assessment Total Assessment is a certain percentage of the fair market value that is determined by local assessors to be the total taxable value of land and additions on the property. | Land | Improvement |
|---|---|---|---|---|
| 2025 | $2,987 | $471,727 | $195,000 | $276,727 |
| 2023 | $2,940 | $373,798 | $151,250 | $222,548 |
| 2022 | $2,461 | $291,123 | $121,000 | $170,123 |
| 2021 | $2,755 | $291,123 | $121,000 | $170,123 |
| 2020 | $2,670 | $266,802 | $121,000 | $145,802 |
| 2019 | $2,668 | $248,796 | $110,000 | $138,796 |
| 2018 | $2,635 | $242,211 | $110,000 | $132,211 |
| 2017 | $1,983 | $226,346 | $110,000 | $116,346 |
| 2016 | $1,911 | $166,500 | $80,000 | $86,500 |
| 2014 | -- | $167,065 | $70,000 | $97,065 |
| 2013 | -- | $190,995 | $87,500 | $103,495 |
Source: Public Records
Map
Nearby Homes
- 337 Hyde Ct NE
- 336 Hyde Ct NE
- 360 Lakeview Loop NE
- 314 Lakeview Loop NE
- 366 Lakeview Loop NE
- 341 Duck Lake Dr NE
- 308 Lakeview Loop NE
- 359 Duck Lake Dr NE
- 387 Duck Lake Dr NE
- 318 Duck Lake Dr NE
- 394 Lakeview Loop NE
- 0 Smith Ave Unit PI25190316
- 301 Olympic View Ave NE
- 284 Duck Lake Dr NE
- 413 Lakeview Loop NE
- 242 Duck Lake Dr NE
- 470 Lake West Loop NE
- 254 Olympic View Ave NE
- 232 Fisher Ave NE
- 229 Olympic View Ave NE
- 341 Lakeview Loop NE
- 355 Lakeview Loop NE
- 334 Hyde Ct NE
- 350 Lakeview Loop NE
- 331 Lakeview Loop NE
- 365 Lakeview Loop NE
- 335 Hyde Ct NE
- 352 Lakeview Loop NE
- 356 Lakeview Loop NE
- 325 Lakeview Loop NE
- 338 Hyde Ct NE
- 321 Lakeview Loop NE
- 375 Lakeview Loop NE
- 326 Lakeview Loop NE
- 343 Duck Lake Dr NE
- 370 Lakeview Loop NE
- 353 Duck Lake Dr NE
- 347 Duck Lake Dr NE
- 347 353 Duck Lake Dr NE
- 320 Lakeview Loop NE