Estimated Value: $242,000 - $382,000
2
Beds
1
Bath
825
Sq Ft
$419/Sq Ft
Est. Value
About This Home
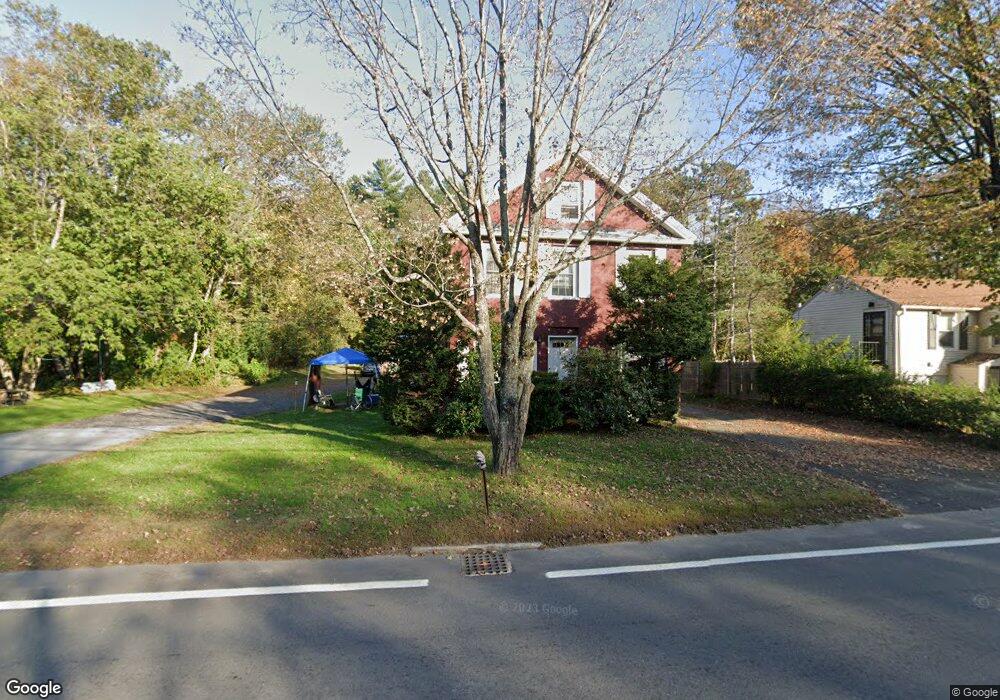
This home is located at 351 Main St S Unit 1st floor, Barre, MA 01005 and is currently estimated at $345,411, approximately $418 per square foot. 351 Main St S Unit 1st floor is a home located in Worcester County with nearby schools including Quabbin Regional Middle School and Quabbin Regional High School.
Ownership History
Date
Name
Owned For
Owner Type
Purchase Details
Closed on
Jul 9, 2004
Sold by
Willette Frederick A
Bought by
Lindsten Richard
Current Estimated Value
Home Financials for this Owner
Home Financials are based on the most recent Mortgage that was taken out on this home.
Original Mortgage
$161,500
Outstanding Balance
$80,059
Interest Rate
6.32%
Mortgage Type
Purchase Money Mortgage
Estimated Equity
$265,352
Create a Home Valuation Report for This Property
The Home Valuation Report is an in-depth analysis detailing your home's value as well as a comparison with similar homes in the area
Home Values in the Area
Average Home Value in this Area
Purchase History
| Date | Buyer | Sale Price | Title Company |
|---|---|---|---|
| Lindsten Richard | $190,000 | -- | |
| Lindsten Richard | $190,000 | -- |
Source: Public Records
Mortgage History
| Date | Status | Borrower | Loan Amount |
|---|---|---|---|
| Open | Lindsten Richard | $161,500 | |
| Closed | Lindsten Richard | $161,500 |
Source: Public Records
Tax History Compared to Growth
Tax History
| Year | Tax Paid | Tax Assessment Tax Assessment Total Assessment is a certain percentage of the fair market value that is determined by local assessors to be the total taxable value of land and additions on the property. | Land | Improvement |
|---|---|---|---|---|
| 2025 | $3,722 | $273,900 | $39,800 | $234,100 |
| 2024 | $3,647 | $260,900 | $37,900 | $223,000 |
| 2023 | $3,792 | $239,100 | $29,500 | $209,600 |
| 2022 | $3,919 | $232,700 | $25,300 | $207,400 |
| 2021 | $3,220 | $178,900 | $25,300 | $153,600 |
| 2020 | $3,197 | $178,900 | $25,300 | $153,600 |
| 2019 | $3,118 | $172,100 | $23,000 | $149,100 |
| 2018 | $2,726 | $145,000 | $23,000 | $122,000 |
| 2017 | $2,712 | $145,000 | $23,000 | $122,000 |
| 2016 | $2,453 | $137,800 | $20,900 | $116,900 |
| 2015 | $2,470 | $132,500 | $25,800 | $106,700 |
| 2014 | $2,334 | $145,300 | $31,800 | $113,500 |
Source: Public Records
Map
Nearby Homes
- 351 Main St S
- 361 Main St S
- 379 Main St S
- 379 Main St S Unit 2
- 366 Main St
- 350 Main St S
- 350 Main St S
- 350 Main St S
- 380 Main St S
- Lot D Peach St
- 340 Main St S Unit 350
- 33 Peach St
- 14 Wheelwright Rd
- 1 Wheelwright Rd
- 330 Main St S
- 20 Fritscher Rd
- 30 Fritscher Rd
- 24 Wheelwright Rd
- 26 Peach St
- 8 Wheelwright Rd