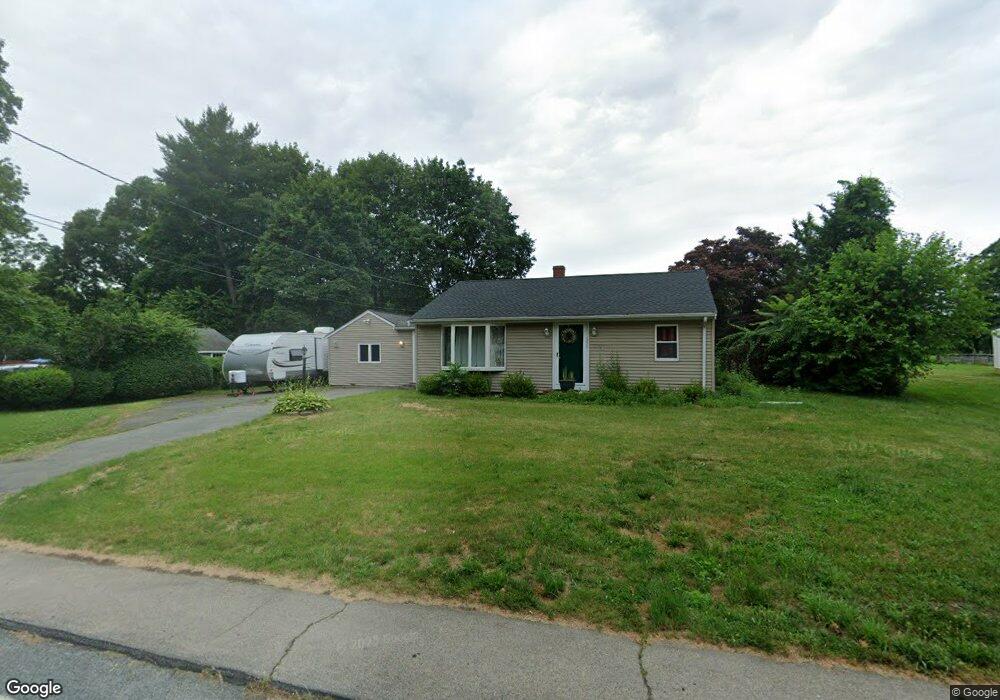
351 N Central St East Bridgewater, MA 02333
Estimated Value: $480,596 - $578,000
3
Beds
1
Bath
1,517
Sq Ft
$338/Sq Ft
Est. Value
About This Home
This home is located at 351 N Central St, East Bridgewater, MA 02333 and is currently estimated at $512,399, approximately $337 per square foot. 351 N Central St is a home located in Plymouth County with nearby schools including Gordon W Mitchell Middle School, East Bridgewater Jr./Sr. High School, and New Heights Charter School.
Ownership History
Date
Name
Owned For
Owner Type
Purchase Details
Closed on
Apr 29, 2011
Sold by
Brennan David B
Bought by
James Henry A and Smalley Kaitlyn A
Current Estimated Value
Home Financials for this Owner
Home Financials are based on the most recent Mortgage that was taken out on this home.
Original Mortgage
$238,341
Outstanding Balance
$163,532
Interest Rate
4.76%
Mortgage Type
Purchase Money Mortgage
Estimated Equity
$348,867
Purchase Details
Closed on
Jul 30, 1993
Sold by
Dyer Douglas E and Donnelly Kathleen A
Bought by
Brennan David B and Brennan Sharon
Home Financials for this Owner
Home Financials are based on the most recent Mortgage that was taken out on this home.
Original Mortgage
$109,250
Interest Rate
7.32%
Mortgage Type
Purchase Money Mortgage
Purchase Details
Closed on
Jan 22, 1990
Sold by
Coles John A
Bought by
Dyer Douglas E
Create a Home Valuation Report for This Property
The Home Valuation Report is an in-depth analysis detailing your home's value as well as a comparison with similar homes in the area
Home Values in the Area
Average Home Value in this Area
Purchase History
| Date | Buyer | Sale Price | Title Company |
|---|---|---|---|
| James Henry A | $230,000 | -- | |
| Brennan David B | $115,000 | -- | |
| Dyer Douglas E | $122,500 | -- |
Source: Public Records
Mortgage History
| Date | Status | Borrower | Loan Amount |
|---|---|---|---|
| Open | James Henry A | $238,341 | |
| Previous Owner | Dyer Douglas E | $134,000 | |
| Previous Owner | Dyer Douglas E | $131,000 | |
| Previous Owner | Dyer Douglas E | $109,000 | |
| Previous Owner | Dyer Douglas E | $109,250 |
Source: Public Records
Tax History Compared to Growth
Tax History
| Year | Tax Paid | Tax Assessment Tax Assessment Total Assessment is a certain percentage of the fair market value that is determined by local assessors to be the total taxable value of land and additions on the property. | Land | Improvement |
|---|---|---|---|---|
| 2025 | $4,861 | $355,600 | $166,800 | $188,800 |
| 2024 | $4,779 | $345,300 | $160,400 | $184,900 |
| 2023 | $4,767 | $329,900 | $160,400 | $169,500 |
| 2022 | $4,711 | $302,000 | $145,900 | $156,100 |
| 2021 | $4,845 | $273,800 | $140,200 | $133,600 |
| 2020 | $5,756 | $267,500 | $134,800 | $132,700 |
| 2019 | $4,557 | $259,500 | $128,900 | $130,600 |
| 2018 | $4,368 | $243,200 | $128,900 | $114,300 |
| 2017 | $4,273 | $233,500 | $122,900 | $110,600 |
| 2016 | $4,193 | $230,900 | $122,900 | $108,000 |
| 2015 | $4,076 | $229,500 | $122,000 | $107,500 |
| 2014 | $3,915 | $225,400 | $119,500 | $105,900 |
Source: Public Records
Map
Nearby Homes
- 324 W Union St
- 505 N Central St
- 11 Willow Ave
- 16 Pearl St
- 38 Leland St
- 22 Water St
- 50 Belmont St
- 245-r Laurel St
- 11 Harmony Crossing
- 386 Matfield St
- 391 Bedford St
- 386 Bedford St
- 6 Andrea Way
- 1 Thomas Cir
- 590 Bedford St
- 585 N Bedford St
- 34 Captain Carlson Way
- 479 Central St
- 578 Plain St
- 139 Geralynn Dr
- 363 N Central St
- 337 N Central St
- 334 N Central St
- 327 N Central St
- 324 N Central St
- 318 N Central St
- 297 N Central St
- 13 Cross St
- 000 Pleasant St
- 55 Cross St
- 29 Pleasant St
- 24 Pleasant St
- 419 N Central St
- 34 Pleasant St
- 49 Pleasant St
- 36 Cross St
- 418 N Central St
- 50 Cross St
- Approx.301 Oak St
- 79 Pleasant St