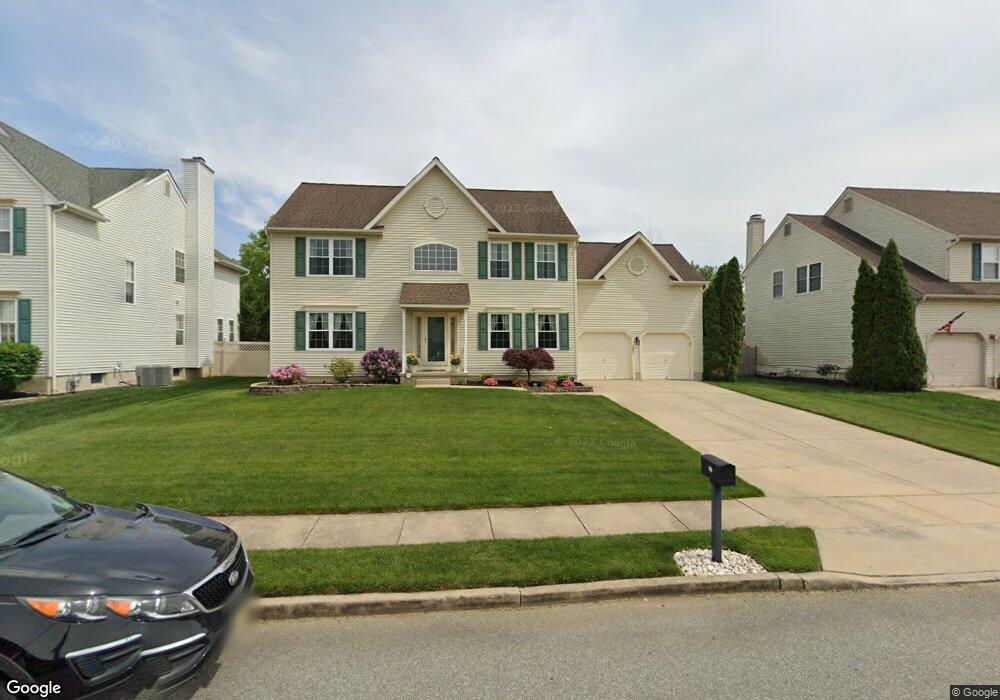
351 New Castle Ln Swedesboro, NJ 08085
Logan Township NeighborhoodEstimated Value: $389,000 - $541,000
--
Bed
--
Bath
2,326
Sq Ft
$200/Sq Ft
Est. Value
About This Home
This home is located at 351 New Castle Ln, Swedesboro, NJ 08085 and is currently estimated at $465,573, approximately $200 per square foot. 351 New Castle Ln is a home located in Gloucester County with nearby schools including Logan Township Elementary School.
Ownership History
Date
Name
Owned For
Owner Type
Purchase Details
Closed on
Aug 30, 2024
Sold by
Silver David W and Silver Denise L
Bought by
Williams Sean T and Williams Erica H
Current Estimated Value
Home Financials for this Owner
Home Financials are based on the most recent Mortgage that was taken out on this home.
Original Mortgage
$200,000
Outstanding Balance
$195,119
Interest Rate
6.78%
Mortgage Type
New Conventional
Estimated Equity
$270,454
Purchase Details
Closed on
May 28, 1997
Sold by
Executive Estates Inc
Bought by
Silver David W and Silver Denise L
Purchase Details
Closed on
Nov 25, 1996
Sold by
C P Beckett Group Inc
Bought by
Executive Estates Inc
Home Financials for this Owner
Home Financials are based on the most recent Mortgage that was taken out on this home.
Original Mortgage
$31,500
Interest Rate
7.46%
Create a Home Valuation Report for This Property
The Home Valuation Report is an in-depth analysis detailing your home's value as well as a comparison with similar homes in the area
Home Values in the Area
Average Home Value in this Area
Purchase History
| Date | Buyer | Sale Price | Title Company |
|---|---|---|---|
| Williams Sean T | $350,000 | National Integrity | |
| Williams Sean T | $350,000 | National Integrity | |
| Silver David W | $171,377 | Congress Title Corp | |
| Executive Estates Inc | $31,500 | Congress Title Division | |
| C P Beckett Group Inc | $23,250 | Congress Title Division |
Source: Public Records
Mortgage History
| Date | Status | Borrower | Loan Amount |
|---|---|---|---|
| Open | Williams Sean T | $200,000 | |
| Closed | Williams Sean T | $200,000 | |
| Previous Owner | Executive Estates Inc | $31,500 |
Source: Public Records
Tax History Compared to Growth
Tax History
| Year | Tax Paid | Tax Assessment Tax Assessment Total Assessment is a certain percentage of the fair market value that is determined by local assessors to be the total taxable value of land and additions on the property. | Land | Improvement |
|---|---|---|---|---|
| 2025 | $6,007 | $462,100 | $87,800 | $374,300 |
| 2024 | $5,731 | $462,100 | $87,800 | $374,300 |
| 2023 | $5,731 | $285,100 | $75,400 | $209,700 |
| 2022 | $5,956 | $285,100 | $75,400 | $209,700 |
| 2021 | $6,172 | $285,100 | $75,400 | $209,700 |
| 2020 | $6,201 | $285,100 | $75,400 | $209,700 |
| 2019 | $6,192 | $285,100 | $75,400 | $209,700 |
| 2018 | $6,021 | $285,100 | $75,400 | $209,700 |
| 2017 | $6,573 | $262,200 | $63,000 | $199,200 |
| 2016 | $6,466 | $262,200 | $63,000 | $199,200 |
| 2015 | $5,716 | $262,200 | $63,000 | $199,200 |
| 2014 | $5,543 | $262,200 | $63,000 | $199,200 |
Source: Public Records
Map
Nearby Homes
- 112 Carriage Ln
- 55 Hamilton St
- 111 Peachwood Dr
- 23 Adams St
- 17 Hickory Ln
- 142 Ramona Ln
- 364 High Hill Rd
- 135 Juniper Ln
- 120 Edward Dr
- 217 Spruce Trail
- 18 Dogwood Place
- 9 Brattleboro Rd
- 209 Windsor Dr
- 229 Westbrook Dr
- 203 Amesbury Blvd
- 144 Robins Run W
- 128 Robins Run W
- 330 Taft Dr
- 4 Hylton Rd
- 2153 Route 322
- 353 New Castle Ln
- 349 New Castle Ln
- 311 New Castle Ln
- 347 New Castle Ln
- 355 New Castle Ln
- 313 New Castle Ln
- 309 New Castle Ln
- 315 New Castle Ln
- 368 New Castle Ln
- 366 New Castle Ln
- 370 New Castle Ln
- 357 New Castle Ln
- 345 New Castle Ln
- 307 New Castle Ln
- 364 New Castle Ln
- 372 New Castle Ln
- 362 New Castle Ln
- 305 New Castle Ln
- 343 New Castle Ln
- 11 Surrey Place