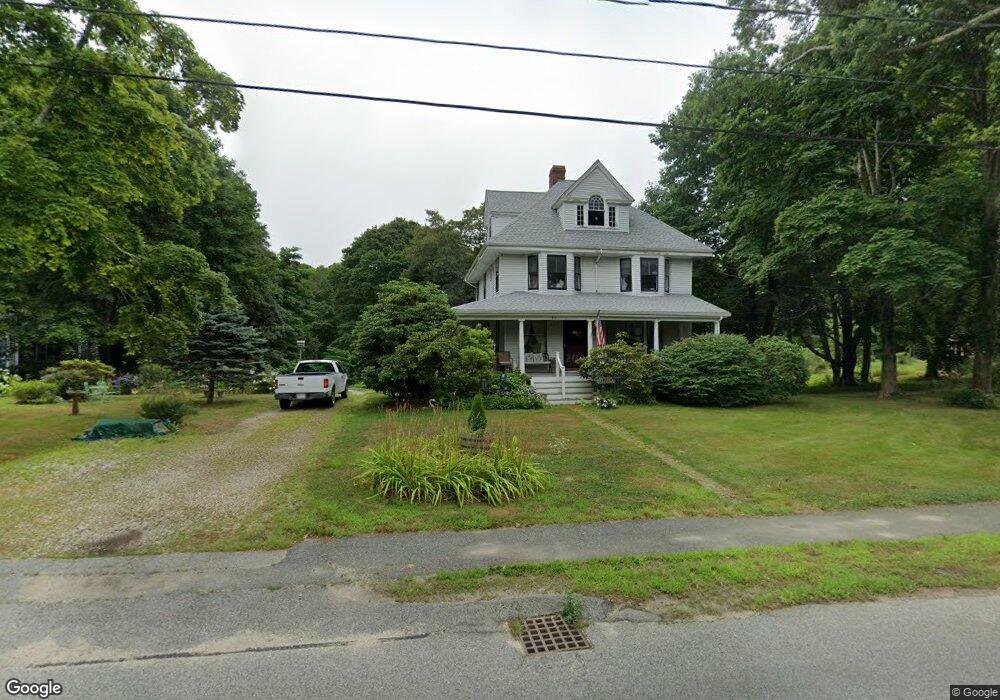
351 Old Main Rd North Falmouth, MA 02556
North Falmouth NeighborhoodEstimated Value: $939,000 - $1,129,000
5
Beds
4
Baths
2,626
Sq Ft
$388/Sq Ft
Est. Value
About This Home
This home is located at 351 Old Main Rd, North Falmouth, MA 02556 and is currently estimated at $1,018,805, approximately $387 per square foot. 351 Old Main Rd is a home located in Barnstable County with nearby schools including North Falmouth Elementary School, Morse Pond School, and Lawrence School.
Ownership History
Date
Name
Owned For
Owner Type
Purchase Details
Closed on
Sep 21, 2023
Sold by
Stone Patricia N
Bought by
Patricia Stone 2023 T and Patricia Stone
Current Estimated Value
Purchase Details
Closed on
Jan 1, 1964
Bought by
Stone William E and Stone Patricia N
Create a Home Valuation Report for This Property
The Home Valuation Report is an in-depth analysis detailing your home's value as well as a comparison with similar homes in the area
Home Values in the Area
Average Home Value in this Area
Purchase History
| Date | Buyer | Sale Price | Title Company |
|---|---|---|---|
| Patricia Stone 2023 T | -- | None Available | |
| Patricia Stone 2023 T | -- | None Available | |
| Stone William E | -- | -- |
Source: Public Records
Mortgage History
| Date | Status | Borrower | Loan Amount |
|---|---|---|---|
| Previous Owner | Stone William E | $10,000 |
Source: Public Records
Tax History Compared to Growth
Tax History
| Year | Tax Paid | Tax Assessment Tax Assessment Total Assessment is a certain percentage of the fair market value that is determined by local assessors to be the total taxable value of land and additions on the property. | Land | Improvement |
|---|---|---|---|---|
| 2025 | $4,530 | $771,800 | $320,300 | $451,500 |
| 2024 | $4,289 | $682,900 | $280,300 | $402,600 |
| 2023 | $4,134 | $597,400 | $220,200 | $377,200 |
| 2022 | $4,345 | $539,700 | $194,100 | $345,600 |
| 2021 | $4,451 | $523,600 | $178,000 | $345,600 |
| 2020 | $4,359 | $507,400 | $161,800 | $345,600 |
| 2019 | $4,206 | $491,300 | $161,800 | $329,500 |
| 2018 | $4,072 | $473,500 | $161,800 | $311,700 |
| 2017 | $3,771 | $442,100 | $161,800 | $280,300 |
| 2016 | $3,700 | $442,100 | $161,800 | $280,300 |
| 2015 | $3,562 | $434,900 | $161,800 | $273,100 |
| 2014 | $3,361 | $412,400 | $170,200 | $242,200 |
Source: Public Records
Map
Nearby Homes
- 359 Old Main Rd
- 343 Old Main Rd
- 66 Windward Way
- 337 Old Main Rd
- 74 Windward Way
- 335 Old Main Rd
- 333 Old Main Rd
- 48 Windward Way
- 59 Windward Way
- 368 Old Main Rd
- 53 Windward Way
- 67 Windward Way
- 10 Windward Way
- 4 Windward Way
- 45 Windward Way
- 42 Windward Way
- 75 Windward Way
- 16 Windward Way Unit 4
- 16 Windward Way Unit 3
- 16 Windward Way Unit 2