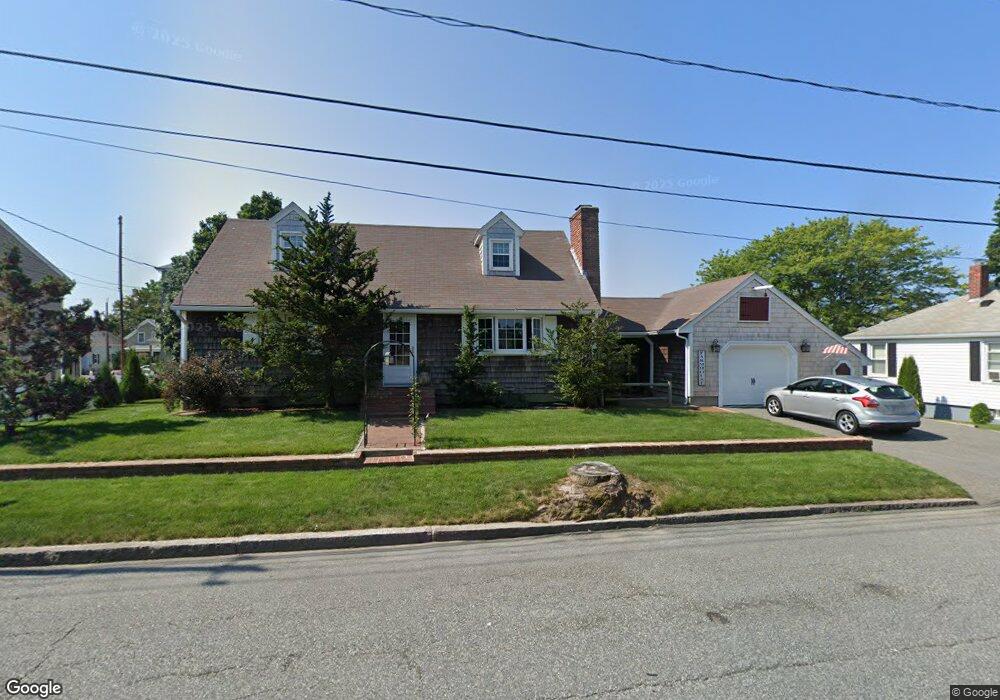
351 Orswell St Fall River, MA 02724
Maplewood NeighborhoodEstimated Value: $400,000 - $435,000
3
Beds
1
Bath
1,805
Sq Ft
$230/Sq Ft
Est. Value
About This Home
This home is located at 351 Orswell St, Fall River, MA 02724 and is currently estimated at $415,477, approximately $230 per square foot. 351 Orswell St is a home located in Bristol County with nearby schools including Letourneau Elementary School, Matthew J. Kuss Middle School, and B M C Durfee High School.
Ownership History
Date
Name
Owned For
Owner Type
Purchase Details
Closed on
Aug 22, 2013
Sold by
Peteira Joan
Bought by
Pereira Stephen D
Current Estimated Value
Purchase Details
Closed on
Mar 16, 1967
Bought by
Pereira Joan and Pereira Stephen D
Create a Home Valuation Report for This Property
The Home Valuation Report is an in-depth analysis detailing your home's value as well as a comparison with similar homes in the area
Home Values in the Area
Average Home Value in this Area
Purchase History
| Date | Buyer | Sale Price | Title Company |
|---|---|---|---|
| Pereira Stephen D | -- | -- | |
| Pereira Stephen D | -- | -- | |
| Pereira Joan | -- | -- | |
| Pereira Stephen D | -- | -- |
Source: Public Records
Mortgage History
| Date | Status | Borrower | Loan Amount |
|---|---|---|---|
| Previous Owner | Pereira Joan | $66,000 | |
| Previous Owner | Pereira Joan | $75,000 | |
| Previous Owner | Pereira Joan | $80,000 |
Source: Public Records
Tax History
| Year | Tax Paid | Tax Assessment Tax Assessment Total Assessment is a certain percentage of the fair market value that is determined by local assessors to be the total taxable value of land and additions on the property. | Land | Improvement |
|---|---|---|---|---|
| 2025 | $3,891 | $339,800 | $118,800 | $221,000 |
| 2024 | $3,715 | $323,300 | $116,500 | $206,800 |
| 2023 | $3,744 | $305,100 | $105,000 | $200,100 |
| 2022 | $3,171 | $268,000 | $99,000 | $169,000 |
| 2021 | $3,171 | $229,300 | $94,600 | $134,700 |
| 2020 | $2,990 | $206,900 | $90,300 | $116,600 |
| 2019 | $3,024 | $207,400 | $94,400 | $113,000 |
| 2018 | $3,006 | $205,600 | $95,100 | $110,500 |
| 2017 | $2,855 | $203,900 | $95,100 | $108,800 |
| 2016 | $2,749 | $201,700 | $98,000 | $103,700 |
| 2015 | $2,638 | $201,700 | $98,000 | $103,700 |
| 2014 | $2,537 | $201,700 | $98,000 | $103,700 |
Source: Public Records
Map
Nearby Homes
Your Personal Tour Guide
Ask me questions while you tour the home.