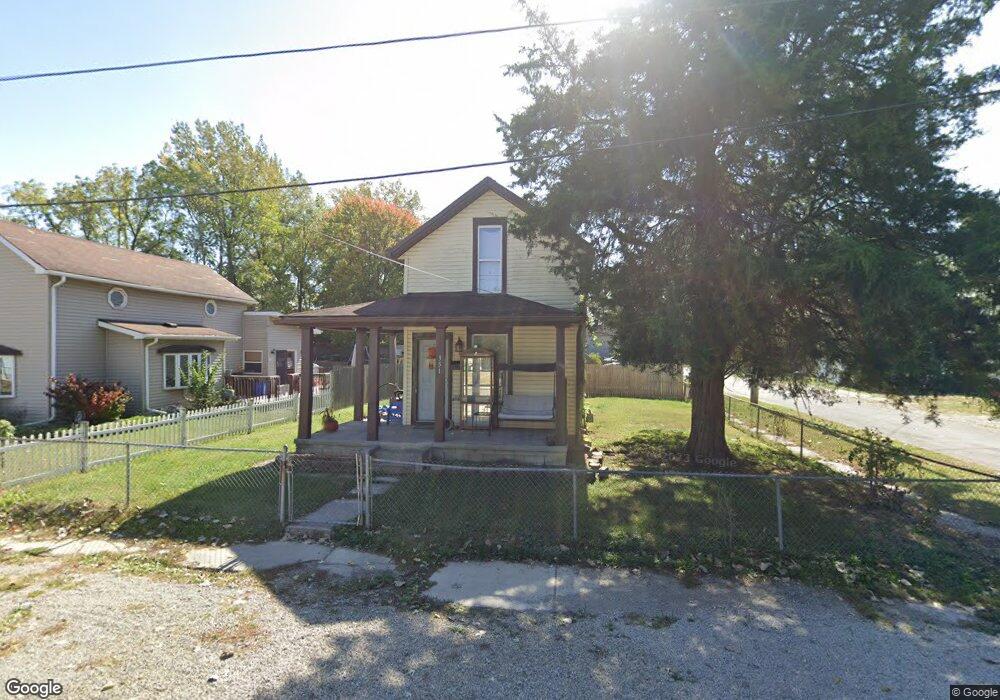
351 Owens St Marion, OH 43302
Estimated Value: $50,000 - $101,000
2
Beds
1
Bath
1,221
Sq Ft
$60/Sq Ft
Est. Value
About This Home
This home is located at 351 Owens St, Marion, OH 43302 and is currently estimated at $73,373, approximately $60 per square foot. 351 Owens St is a home located in Marion County with nearby schools including James A. Garfield Elementary School, Ulysses S. Grant Middle School, and Harding High School.
Ownership History
Date
Name
Owned For
Owner Type
Purchase Details
Closed on
Nov 13, 2018
Sold by
Titus Robert J and Titus Debra S
Bought by
Rtr Rentals Llc
Current Estimated Value
Purchase Details
Closed on
Nov 7, 2017
Sold by
Carey Max and Carey Luanne
Bought by
Titus Robert J
Purchase Details
Closed on
Aug 7, 2017
Sold by
Will Greg S and Will Jennifer L
Bought by
Carey Max
Purchase Details
Closed on
Apr 1, 2009
Sold by
Deutsche Bank National Trust Co
Bought by
Will Greg S and Will Jennifer L
Purchase Details
Closed on
Jun 13, 2008
Sold by
Jarrell Samuel
Bought by
Deutsche Bank National Trust Co
Purchase Details
Closed on
Feb 28, 2005
Sold by
Diaz Eliezer and Diaz Sandra D
Bought by
Jarrell Samuel and Jarrell Jemie
Home Financials for this Owner
Home Financials are based on the most recent Mortgage that was taken out on this home.
Original Mortgage
$54,400
Interest Rate
10.05%
Mortgage Type
Assumption
Purchase Details
Closed on
Feb 2, 1995
Bought by
Will Greg S and Will Jennifer L
Create a Home Valuation Report for This Property
The Home Valuation Report is an in-depth analysis detailing your home's value as well as a comparison with similar homes in the area
Home Values in the Area
Average Home Value in this Area
Purchase History
| Date | Buyer | Sale Price | Title Company |
|---|---|---|---|
| Rtr Rentals Llc | -- | None Available | |
| Titus Robert J | $32,500 | Attorney | |
| Carey Max | $10,000 | Attorney | |
| Will Greg S | $7,500 | Ryan Accutitle Agency | |
| Deutsche Bank National Trust Co | $59,000 | None Available | |
| Jarrell Samuel | $68,000 | P I T S Supreme Title | |
| Will Greg S | $8,400 | -- |
Source: Public Records
Mortgage History
| Date | Status | Borrower | Loan Amount |
|---|---|---|---|
| Previous Owner | Jarrell Samuel | $54,400 |
Source: Public Records
Tax History Compared to Growth
Tax History
| Year | Tax Paid | Tax Assessment Tax Assessment Total Assessment is a certain percentage of the fair market value that is determined by local assessors to be the total taxable value of land and additions on the property. | Land | Improvement |
|---|---|---|---|---|
| 2024 | $571 | $14,840 | $1,530 | $13,310 |
| 2023 | $571 | $14,840 | $1,530 | $13,310 |
| 2022 | $537 | $14,840 | $1,530 | $13,310 |
| 2021 | $662 | $11,560 | $1,330 | $10,230 |
| 2020 | $460 | $11,560 | $1,330 | $10,230 |
| 2019 | $608 | $11,560 | $1,330 | $10,230 |
| 2018 | $417 | $10,500 | $1,310 | $9,190 |
| 2017 | $423 | $10,500 | $1,310 | $9,190 |
| 2016 | $419 | $10,500 | $1,310 | $9,190 |
| 2015 | $430 | $10,540 | $1,240 | $9,300 |
| 2014 | $432 | $10,540 | $1,240 | $9,300 |
| 2012 | $475 | $11,540 | $1,370 | $10,170 |
Source: Public Records
Map
Nearby Homes
- 178 Leader St
- 343 Commercial St
- 325 Holmes Place
- 347 Mary St
- 233 Tully St
- 374 Nunin Ct
- 395 N Main St
- 302 Blaine Ave
- 429 W Columbia St
- 314 Windsor St
- 229 W Columbia St
- 551 Universal Ave Unit 555
- 468 Avondale Ave
- 341 Girard Ave
- 485 Avondale Ave
- 434 N State St
- 343 S Prospect St
- 393 Windsor St
- 552 N Prospect St
- 213 Sharp St