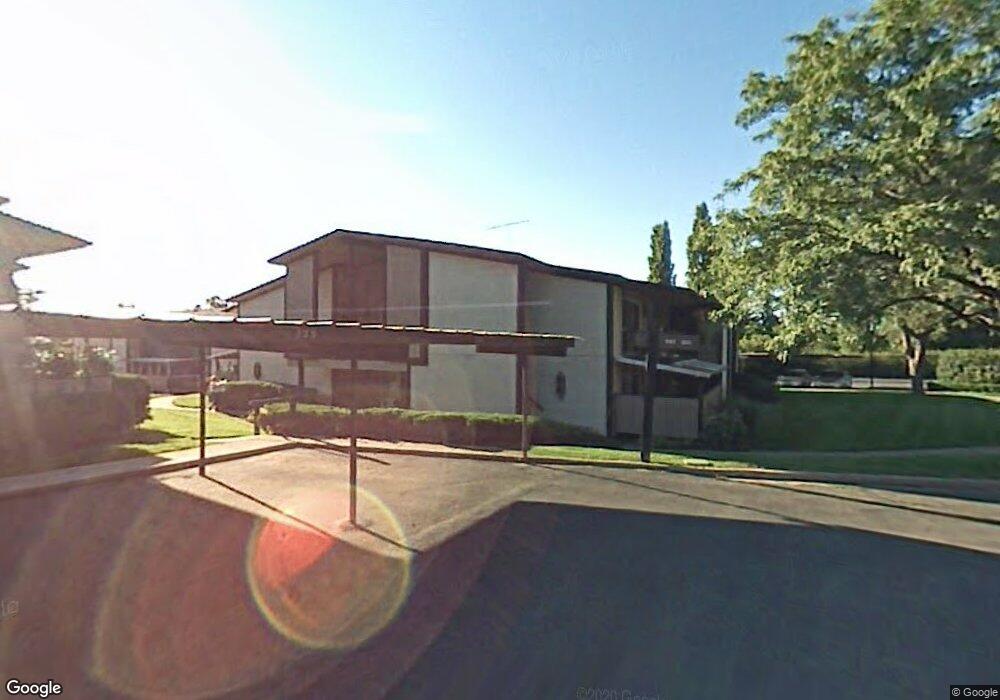
351 Peach Ln Bountiful, UT 84010
Estimated Value: $292,200 - $317,000
2
Beds
2
Baths
1,148
Sq Ft
$267/Sq Ft
Est. Value
About This Home
This home is located at 351 Peach Ln, Bountiful, UT 84010 and is currently estimated at $306,050, approximately $266 per square foot. 351 Peach Ln is a home located in Davis County with nearby schools including Valley View School, Millcreek Junior High School, and Bountiful High School.
Ownership History
Date
Name
Owned For
Owner Type
Purchase Details
Closed on
Mar 9, 2017
Sold by
Weight Lola Jean
Bought by
Weight Lola Jean and Weight Family Trust
Current Estimated Value
Purchase Details
Closed on
Mar 8, 2017
Sold by
Weight Lola Jean and Weight Roy
Bought by
Weight Lola Jean
Purchase Details
Closed on
Apr 20, 2011
Sold by
Baxter Linda Marie
Bought by
Weight Roy and Weight Lola Jean
Purchase Details
Closed on
Dec 13, 2000
Sold by
The Julia H Wood Family Trust
Bought by
Williams Margaret A and Revocable Declaration Of Trust Of Margar
Create a Home Valuation Report for This Property
The Home Valuation Report is an in-depth analysis detailing your home's value as well as a comparison with similar homes in the area
Purchase History
| Date | Buyer | Sale Price | Title Company |
|---|---|---|---|
| Weight Lola Jean | -- | -- | |
| Weight Lola Jean | -- | -- | |
| Weight Roy | -- | Backman Title Servic | |
| Williams Margaret A | -- | Bonneville Title Company Inc |
Source: Public Records
Tax History
| Year | Tax Paid | Tax Assessment Tax Assessment Total Assessment is a certain percentage of the fair market value that is determined by local assessors to be the total taxable value of land and additions on the property. | Land | Improvement |
|---|---|---|---|---|
| 2025 | $1,594 | $148,500 | $48,950 | $99,550 |
| 2024 | $1,534 | $145,750 | $54,450 | $91,300 |
| 2023 | $1,512 | $261,000 | $93,000 | $168,000 |
| 2022 | $1,539 | $145,750 | $32,450 | $113,300 |
| 2021 | $1,483 | $215,000 | $46,000 | $169,000 |
| 2020 | $1,293 | $188,000 | $42,600 | $145,400 |
| 2019 | $1,222 | $173,000 | $39,000 | $134,000 |
| 2018 | $1,108 | $154,000 | $36,000 | $118,000 |
| 2016 | $862 | $64,295 | $12,925 | $51,370 |
| 2015 | $811 | $56,925 | $12,925 | $44,000 |
| 2014 | $754 | $54,280 | $18,333 | $35,947 |
| 2013 | -- | $68,069 | $16,775 | $51,294 |
Source: Public Records
Map
Nearby Homes
- 323 Peach Ln
- 275 E Peach Ln S
- 456 E 500 S
- 255 E 400 S
- 545 S 100 E
- 357 S 100 E
- 698 E 200 S
- 650 S Main St Unit 7107
- 650 S Main St Unit 6206
- 650 S Main St Unit 4104
- 650 S Main St Unit 9106
- 34 W 400 S
- 32 W 400 S
- 380 E 1500 S
- 861 E Millbrook Way
- 683 E 100 N
- 795 Abby Ln Unit 5
- 6 N 800 E
- 775 E 1500 S
- 55 E 200 N Unit 2
Your Personal Tour Guide
Ask me questions while you tour the home.