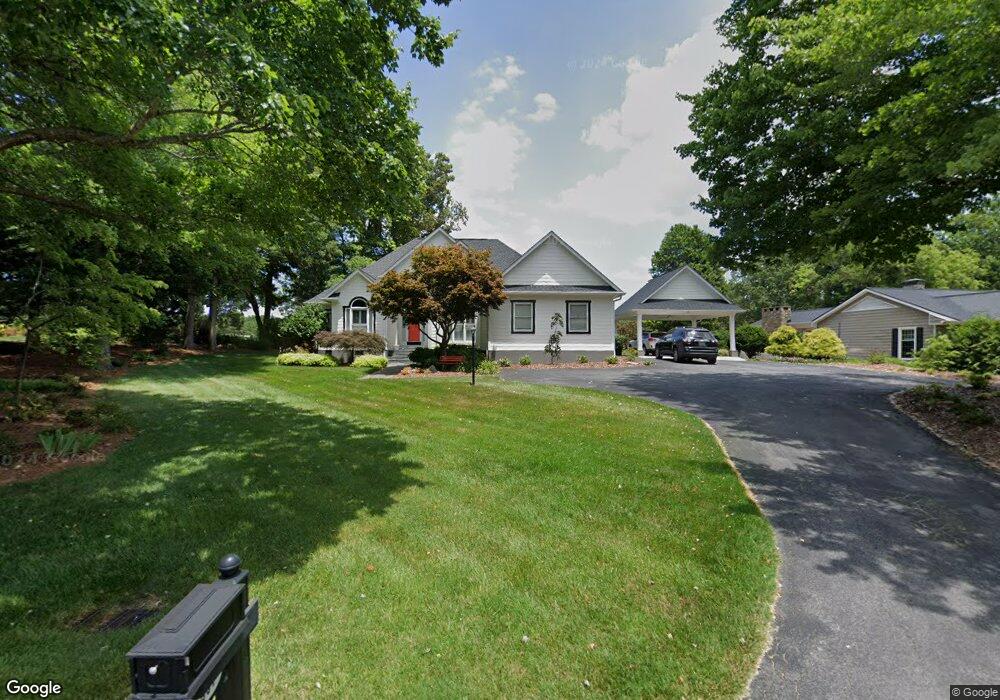
351 Pinewood Rd Asheboro, NC 27205
Estimated Value: $382,058 - $485,000
3
Beds
3
Baths
2,188
Sq Ft
$194/Sq Ft
Est. Value
About This Home
This home is located at 351 Pinewood Rd, Asheboro, NC 27205 and is currently estimated at $424,765, approximately $194 per square foot. 351 Pinewood Rd is a home located in Randolph County with nearby schools including Sycamore Elementary School, Southmont Elementary School, and Southwestern Randolph Middle School.
Ownership History
Date
Name
Owned For
Owner Type
Purchase Details
Closed on
Jan 11, 2018
Sold by
Ridge James W and Ridge Shirley W
Bought by
Ridge Shirley W
Current Estimated Value
Purchase Details
Closed on
Mar 31, 2011
Sold by
Ridge Shirley W and Ridge James W
Bought by
Adams Mitchell K and Adams Gail L
Home Financials for this Owner
Home Financials are based on the most recent Mortgage that was taken out on this home.
Original Mortgage
$205,600
Outstanding Balance
$142,328
Interest Rate
4.95%
Mortgage Type
New Conventional
Estimated Equity
$282,437
Purchase Details
Closed on
Apr 9, 2009
Sold by
Ridge James W
Bought by
Ridge Shirley W
Purchase Details
Closed on
May 12, 1995
Bought by
Adams Mitchell Kadams Gail L
Create a Home Valuation Report for This Property
The Home Valuation Report is an in-depth analysis detailing your home's value as well as a comparison with similar homes in the area
Home Values in the Area
Average Home Value in this Area
Purchase History
| Date | Buyer | Sale Price | Title Company |
|---|---|---|---|
| Ridge Shirley W | -- | None Available | |
| Adams Mitchell K | $257,000 | None Available | |
| Ridge Shirley W | -- | None Available | |
| Adams Mitchell Kadams Gail L | $145,000 | -- |
Source: Public Records
Mortgage History
| Date | Status | Borrower | Loan Amount |
|---|---|---|---|
| Open | Adams Mitchell K | $205,600 |
Source: Public Records
Tax History Compared to Growth
Tax History
| Year | Tax Paid | Tax Assessment Tax Assessment Total Assessment is a certain percentage of the fair market value that is determined by local assessors to be the total taxable value of land and additions on the property. | Land | Improvement |
|---|---|---|---|---|
| 2025 | $1,858 | $298,800 | $42,340 | $256,460 |
| 2024 | $1,858 | $298,800 | $42,340 | $256,460 |
| 2023 | $1,858 | $298,800 | $42,340 | $256,460 |
| 2022 | $1,700 | $225,250 | $38,260 | $186,990 |
| 2021 | $1,700 | $225,250 | $38,260 | $186,990 |
| 2020 | $1,572 | $216,860 | $38,260 | $178,600 |
| 2019 | $1,572 | $216,860 | $38,260 | $178,600 |
| 2018 | $1,611 | $216,550 | $34,440 | $182,110 |
| 2016 | $1,568 | $216,552 | $34,440 | $182,112 |
| 2015 | $1,574 | $216,552 | $34,440 | $182,112 |
| 2014 | $1,537 | $214,665 | $37,540 | $177,125 |
Source: Public Records
Map
Nearby Homes
- Promenade Plan at The Villas at Pinewood
- Portico Plan at The Villas at Pinewood
- Torino Plan at The Villas at Pinewood
- Wellington Plan at The Villas at Pinewood
- 708 Dawson Miller Rd
- 6015 Zoo Pkwy
- 6009 Zoo Pkwy
- 3162 Montclair Ct
- 0 Lisbon Rd
- 167 Drum St
- 916 S Creek Ct
- 1624 Ashbrook View Ln
- 00 Route 220 Hwy
- 0 Ross Harris
- 214 Vancroft St
- o Southmont Dr
- 4263 Zoo Pkwy
- 5979 US Highway 220 S
- 3359 US Highway 220 Bus S
- 3359 U S 220 Business
- 373 Pinewood Rd
- 327 Pinewood Rd
- 381 Pinewood Rd
- 401 Pinewood Rd
- 425 Pinewood Rd
- 394 Pinewood Rd
- 443 Pinewood Rd
- 424 Pinewood Rd
- 2621 Brassie Ct
- 2623 Brassie Ct
- 513 Pinewood Rd
- 450 Pinewood Rd
- 529 Pinewood Rd
- 539 Pinewood Rd
- 376 Birdie Place
- 514 Pinewood Rd
- 2600 Sandtrap Ln
- 360 Birdie Place
- 545 Pinewood Rd
- 518 Pinewood Rd