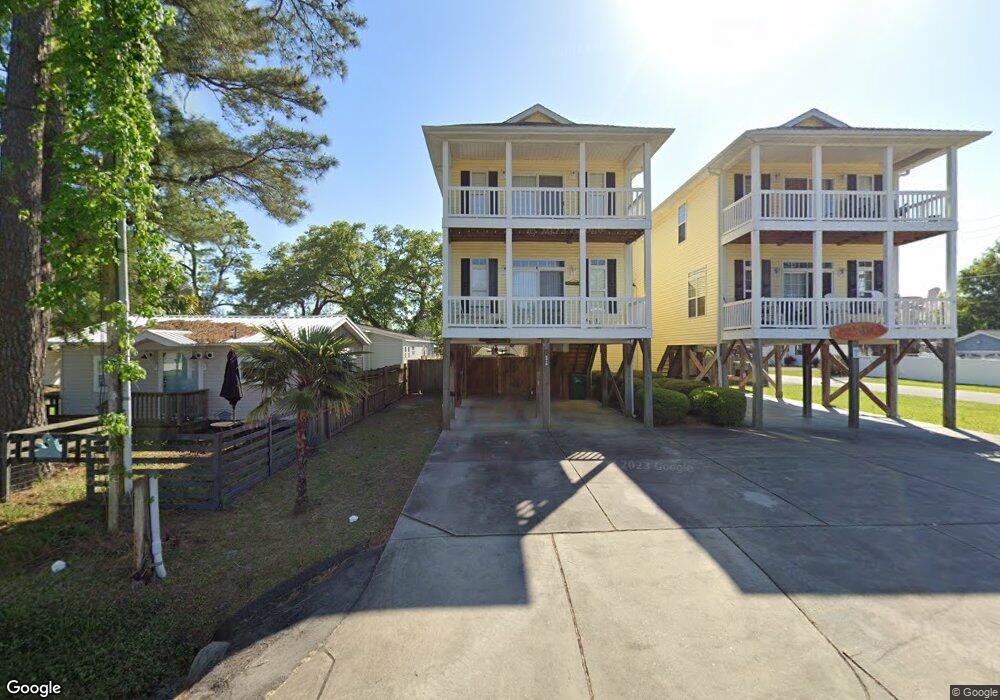
351 Seabreeze Dr Unit A Murrells Inlet, SC 29576
Estimated Value: $584,000 - $791,000
4
Beds
4
Baths
1,865
Sq Ft
$360/Sq Ft
Est. Value
About This Home
This home is located at 351 Seabreeze Dr Unit A, Murrells Inlet, SC 29576 and is currently estimated at $671,302, approximately $359 per square foot. 351 Seabreeze Dr Unit A is a home located in Horry County with nearby schools including Seaside Elementary, St. James Middle School, and St. James Intermediate.
Ownership History
Date
Name
Owned For
Owner Type
Purchase Details
Closed on
Apr 20, 2021
Sold by
Hudson Curtis L
Bought by
Vaughn David W and Vaughn Karen D
Current Estimated Value
Home Financials for this Owner
Home Financials are based on the most recent Mortgage that was taken out on this home.
Original Mortgage
$281,175
Outstanding Balance
$254,272
Interest Rate
3.1%
Mortgage Type
New Conventional
Estimated Equity
$417,030
Purchase Details
Closed on
Nov 7, 2013
Sold by
Tab Of Sc Llc
Bought by
Wilhelm Enterprises Inc and Richardson Developers Llc
Purchase Details
Closed on
Jan 5, 2011
Sold by
American Dream Homes Llc
Bought by
Hudson Curtis L
Purchase Details
Closed on
Nov 7, 2007
Sold by
Innovative Design & Construction Llc
Bought by
Murrells Inlet Group
Home Financials for this Owner
Home Financials are based on the most recent Mortgage that was taken out on this home.
Original Mortgage
$565,300
Interest Rate
6.32%
Mortgage Type
Purchase Money Mortgage
Create a Home Valuation Report for This Property
The Home Valuation Report is an in-depth analysis detailing your home's value as well as a comparison with similar homes in the area
Home Values in the Area
Average Home Value in this Area
Purchase History
| Date | Buyer | Sale Price | Title Company |
|---|---|---|---|
| Vaughn David W | $374,900 | -- | |
| Wilhelm Enterprises Inc | $220,000 | -- | |
| Hudson Curtis L | $260,000 | -- | |
| Murrells Inlet Group | $490,000 | Attorney |
Source: Public Records
Mortgage History
| Date | Status | Borrower | Loan Amount |
|---|---|---|---|
| Open | Vaughn David W | $281,175 | |
| Previous Owner | Murrells Inlet Group | $565,300 |
Source: Public Records
Tax History Compared to Growth
Tax History
| Year | Tax Paid | Tax Assessment Tax Assessment Total Assessment is a certain percentage of the fair market value that is determined by local assessors to be the total taxable value of land and additions on the property. | Land | Improvement |
|---|---|---|---|---|
| 2024 | $5,811 | $42,662 | $24,111 | $18,551 |
| 2023 | $5,811 | $11,606 | $2,355 | $9,251 |
| 2021 | $4,985 | $21,220 | $7,216 | $14,004 |
| 2020 | $978 | $21,220 | $7,216 | $14,004 |
| 2019 | $978 | $21,220 | $7,216 | $14,004 |
| 2018 | $876 | $15,139 | $2,629 | $12,510 |
| 2017 | $861 | $15,139 | $2,629 | $12,510 |
| 2016 | -- | $15,139 | $2,629 | $12,510 |
| 2015 | $861 | $15,140 | $2,630 | $12,510 |
| 2014 | $748 | $15,140 | $2,630 | $12,510 |
Source: Public Records
Map
Nearby Homes
- 310 Marsh Place Unit 108
- 428 Vista Dr
- 914 Dock Place
- 462 Bay Dr
- 919 Dock Place
- 709 Triple Oak Ln
- 235 Calhoun Dr
- 527 Bay Drive Extension
- 399 Elizabeth Dr
- 1509 Cove Ln
- 134 Vista Dr
- 108 Tidal Creek Dr
- 116 Tidal Creek Dr
- 209B Woodland Dr Unit 209B Woodland Dr.
- 539 Woodland Dr
- 1522 Cove Ln
- 537 Woodland Dr
- 146A Seabreeze Dr
- 393 Sanddollar Dr
- 135 Sunset Dr
- 351 Seabreeze Dr
- 351 Seabreeze Dr
- 351 Seabreeze Dr Unit B
- 351A Seabreeze Dr
- 345 Seabreeze Dr
- 347 & 345 Seabreeze Dr
- 347 Seabreeze Dr Unit ID1312356P
- 347 Seabreeze Dr Unit ID1309840P
- 347 Seabreeze Dr
- 119 Seabreeze Dr
- TBD Seabreeze Dr
- 339 Seabreeze Dr
- 409 Seabreeze Dr
- 372 Rainbow Dr
- 376 Rainbow Dr
- 362 Rainbow Dr
- 368 Rainbow Dr
- 335 Seabreeze Dr Unit Garden City- Horry C
- 335 Seabreeze Dr
- 411 Seabreeze Dr