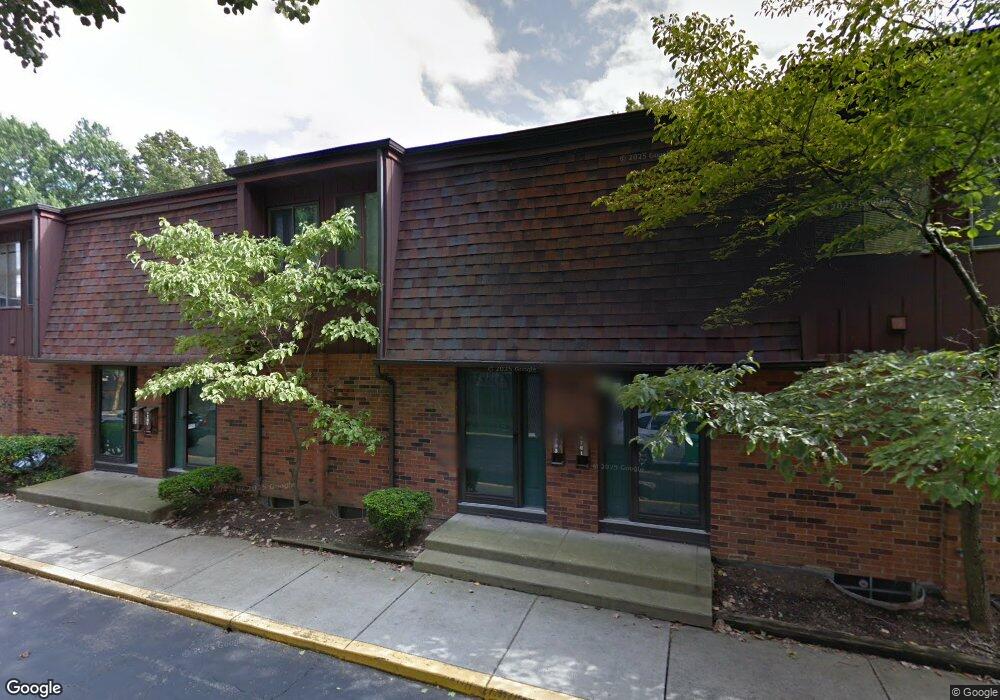
351 Shell Ct E Unit 351 Columbus, OH 43213
Estimated Value: $137,000 - $170,000
2
Beds
2
Baths
952
Sq Ft
$157/Sq Ft
Est. Value
About This Home
This home is located at 351 Shell Ct E Unit 351, Columbus, OH 43213 and is currently estimated at $149,463, approximately $156 per square foot. 351 Shell Ct E Unit 351 is a home located in Franklin County with nearby schools including Etna Road Elementary School, Beechwood Elementary School, and Rosemore Middle School.
Ownership History
Date
Name
Owned For
Owner Type
Purchase Details
Closed on
Dec 4, 2020
Sold by
Mckibben Sharon
Bought by
Gutema Teshale
Current Estimated Value
Home Financials for this Owner
Home Financials are based on the most recent Mortgage that was taken out on this home.
Original Mortgage
$49,470
Outstanding Balance
$43,635
Interest Rate
2.7%
Mortgage Type
New Conventional
Estimated Equity
$105,828
Purchase Details
Closed on
Jul 25, 2010
Sold by
Fannie Mae
Bought by
Mckibben Sharon
Purchase Details
Closed on
Apr 27, 2010
Sold by
Campbell Chad D
Bought by
Federal National Mortgage Association
Purchase Details
Closed on
Jun 23, 2003
Sold by
Muncy Donna J and Muncy Julius
Bought by
Campbell Chad
Home Financials for this Owner
Home Financials are based on the most recent Mortgage that was taken out on this home.
Original Mortgage
$42,750
Interest Rate
5.4%
Mortgage Type
Purchase Money Mortgage
Purchase Details
Closed on
Oct 17, 1979
Bought by
Burns Donna J
Create a Home Valuation Report for This Property
The Home Valuation Report is an in-depth analysis detailing your home's value as well as a comparison with similar homes in the area
Home Values in the Area
Average Home Value in this Area
Purchase History
| Date | Buyer | Sale Price | Title Company |
|---|---|---|---|
| Gutema Teshale | $51,000 | Axxis Title Agency Ltd | |
| Mckibben Sharon | $15,000 | None Available | |
| Federal National Mortgage Association | $30,000 | None Available | |
| Campbell Chad | $45,000 | -- | |
| Burns Donna J | $27,700 | -- |
Source: Public Records
Mortgage History
| Date | Status | Borrower | Loan Amount |
|---|---|---|---|
| Open | Gutema Teshale | $49,470 | |
| Previous Owner | Campbell Chad | $42,750 |
Source: Public Records
Tax History
| Year | Tax Paid | Tax Assessment Tax Assessment Total Assessment is a certain percentage of the fair market value that is determined by local assessors to be the total taxable value of land and additions on the property. | Land | Improvement |
|---|---|---|---|---|
| 2025 | $1,237 | $28,290 | $5,780 | $22,510 |
| 2024 | $1,237 | $28,290 | $5,780 | $22,510 |
| 2023 | $1,228 | $28,280 | $5,775 | $22,505 |
| 2022 | $958 | $16,770 | $1,890 | $14,880 |
| 2021 | $899 | $16,770 | $1,890 | $14,880 |
| 2020 | $426 | $16,770 | $1,890 | $14,880 |
| 2019 | $225 | $12,430 | $1,400 | $11,030 |
| 2018 | $115 | $12,430 | $1,400 | $11,030 |
| 2017 | $217 | $12,430 | $1,400 | $11,030 |
| 2016 | $0 | $7,740 | $2,210 | $5,530 |
| 2015 | -- | $7,740 | $2,210 | $5,530 |
| 2014 | $11 | $7,740 | $2,210 | $5,530 |
| 2013 | $11 | $9,100 | $2,590 | $6,510 |
Source: Public Records
Map
Nearby Homes
- 413 Shell Ct E Unit K413
- 547 Country Club Rd
- 4517 Saint Rita Ln
- 4662 Jae Ave
- 491 Westphal Ave
- 4623 Langley Ave
- 225 Santa Maria Ln
- 686 Fairway Blvd
- 695 Erickson Ave
- 745 Pierce Ave
- 931 Antwerp Rd
- 4148 Elbern Ave
- 746 S Yearling Rd
- 4117 Elbern Ave
- 798 S Yearling Rd
- 1085 S Hamilton Rd
- 4174 Wright Park
- 110 Ironclad Dr Unit 9
- 963 Erickson Ave
- 4991 Justin Rd
- 355 Shell Ct E
- 357 Shell Ct E Unit N357
- 4789 Shell Ct N Unit O4789
- 4787 Shell Ct N
- 359 Shell Ct E Unit 359
- 4785 Shell Ct N
- 4783 Shell Ct N
- 361 Shell Ct E Unit N361
- 361 Shell Ct E Unit E
- 4781 Shell Ct N Unit 4781
- 363 Shell Ct E Unit N363
- 4779 Shell Ct N
- 4777 Shell Ct N Unit O4777
- 365 Shell Ct E
- 367 Shell Ct E Unit N367
- 4775 Shell Ct N Unit O4775
- 371 Shell Ct E
- 373 Shell Ct E
- 4773 Shell Ct N
- 369 Shell Ct E
Your Personal Tour Guide
Ask me questions while you tour the home.