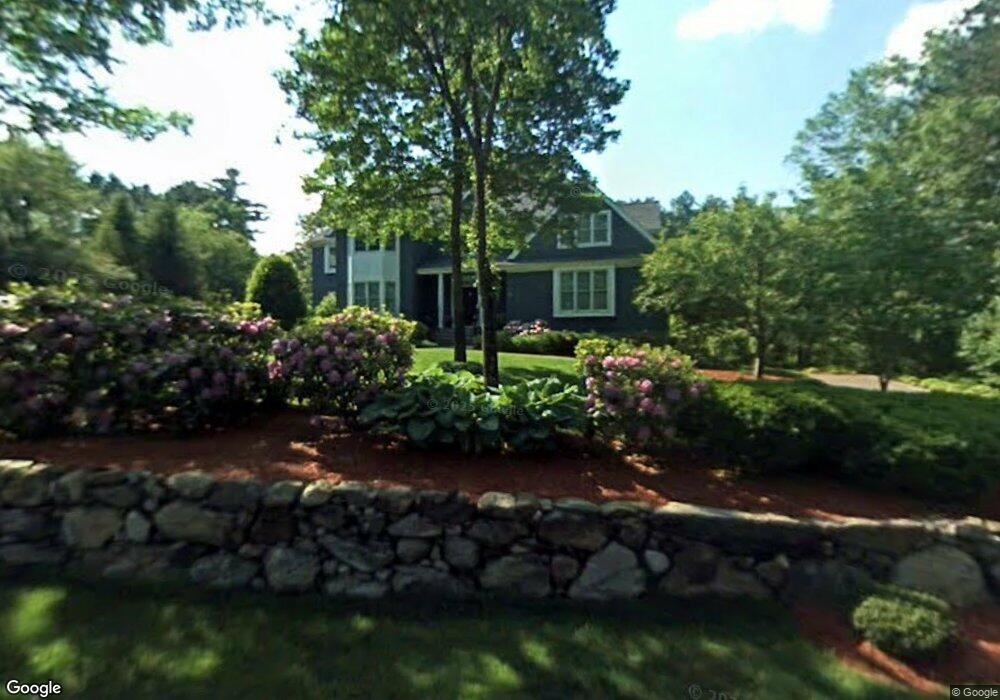
351 South St Needham, MA 02492
Estimated Value: $2,061,440 - $2,727,000
5
Beds
3
Baths
4,029
Sq Ft
$601/Sq Ft
Est. Value
About This Home
This home is located at 351 South St, Needham, MA 02492 and is currently estimated at $2,421,110, approximately $600 per square foot. 351 South St is a home located in Norfolk County with nearby schools including Newman Elementary School, High Rock Middle School, and Pollard Middle School.
Ownership History
Date
Name
Owned For
Owner Type
Purchase Details
Closed on
Jan 9, 2013
Sold by
Irwin Daniel P and Howard Sheila M
Bought by
Irwin Howard Rt
Current Estimated Value
Purchase Details
Closed on
Aug 16, 2001
Sold by
Wilson James M
Bought by
Irwin Daniel P
Home Financials for this Owner
Home Financials are based on the most recent Mortgage that was taken out on this home.
Original Mortgage
$420,000
Interest Rate
7.16%
Mortgage Type
Purchase Money Mortgage
Purchase Details
Closed on
Feb 28, 1997
Sold by
Sunpath Designs Inc
Bought by
Wilson James M
Home Financials for this Owner
Home Financials are based on the most recent Mortgage that was taken out on this home.
Original Mortgage
$325,000
Interest Rate
7.78%
Mortgage Type
Purchase Money Mortgage
Create a Home Valuation Report for This Property
The Home Valuation Report is an in-depth analysis detailing your home's value as well as a comparison with similar homes in the area
Home Values in the Area
Average Home Value in this Area
Purchase History
| Date | Buyer | Sale Price | Title Company |
|---|---|---|---|
| Irwin Howard Rt | -- | -- | |
| Irwin Daniel P | $1,140,000 | -- | |
| Wilson James M | $646,800 | -- |
Source: Public Records
Mortgage History
| Date | Status | Borrower | Loan Amount |
|---|---|---|---|
| Previous Owner | Wilson James M | $420,000 | |
| Previous Owner | Wilson James M | $325,000 | |
| Previous Owner | Wilson James M | $450,000 | |
| Previous Owner | Wilson James M | $58,000 |
Source: Public Records
Tax History Compared to Growth
Tax History
| Year | Tax Paid | Tax Assessment Tax Assessment Total Assessment is a certain percentage of the fair market value that is determined by local assessors to be the total taxable value of land and additions on the property. | Land | Improvement |
|---|---|---|---|---|
| 2025 | $18,701 | $1,764,200 | $910,000 | $854,200 |
| 2024 | $15,908 | $1,270,600 | $709,800 | $560,800 |
| 2023 | $16,011 | $1,227,800 | $709,800 | $518,000 |
| 2022 | $16,060 | $1,201,200 | $709,800 | $491,400 |
| 2021 | $15,652 | $1,201,200 | $709,800 | $491,400 |
| 2020 | $15,384 | $1,231,700 | $709,800 | $521,900 |
| 2019 | $15,203 | $1,227,000 | $709,800 | $517,200 |
| 2018 | $14,577 | $1,227,000 | $709,800 | $517,200 |
| 2017 | $15,147 | $1,273,900 | $709,800 | $564,100 |
| 2016 | $14,701 | $1,273,900 | $709,800 | $564,100 |
| 2015 | $14,382 | $1,273,900 | $709,800 | $564,100 |
| 2014 | $14,573 | $1,252,000 | $709,800 | $542,200 |
Source: Public Records
Map
Nearby Homes
- 178 South St
- 317 Dedham Ave
- 120 Wildwood Dr
- 129 Lawton Rd
- 133 Lawton Rd
- 37 Cottage Cir
- 37 Cottage Cir Unit 37
- 1011 Webster St
- 53 Heather Ln
- 175 Schoolmaster Ln
- 247 Broad Meadow Rd
- 26 Pinewood Rd
- 98 Heather Ln
- 233 Warren St
- 1206 Greendale Ave Unit 201
- 97 Great Plain Ave
- 1052 Greendale Ave
- 828 South St
- 47 Emerson Rd
- 50 Sterling Rd