Estimated Value: $101,000 - $127,000
4
Beds
1
Bath
968
Sq Ft
$116/Sq Ft
Est. Value
About This Home
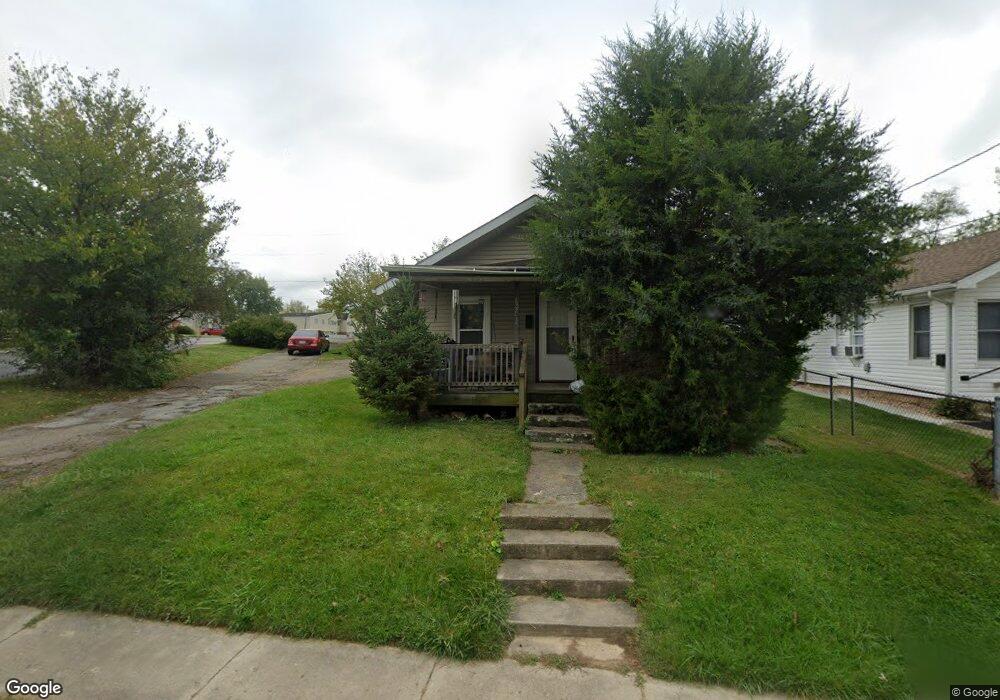
This home is located at 351 Stelton Rd, Xenia, OH 45385 and is currently estimated at $112,667, approximately $116 per square foot. 351 Stelton Rd is a home located in Greene County with nearby schools including Xenia High School, Summit Academy Community School for Alternative Learners - Xenia, and Legacy Christian Academy.
Ownership History
Date
Name
Owned For
Owner Type
Purchase Details
Closed on
Mar 26, 2022
Sold by
351 Stelton Llc
Bought by
Red River Talents Llc
Current Estimated Value
Purchase Details
Closed on
Nov 16, 2018
Sold by
Siwo Michael A
Bought by
351 Stelton Llc
Purchase Details
Closed on
Sep 26, 2011
Sold by
Secretary Of Veterans Affairs
Bought by
Siwo Michael A
Purchase Details
Closed on
Jun 17, 2011
Sold by
Lewis George W and Elizabeth Lewis N
Bought by
Secretary Of Veterans Affairs
Purchase Details
Closed on
Jun 30, 2000
Sold by
Palmer Marion F and Palmer Suellen
Bought by
Lewis George W and Elizabeth Lewis N
Home Financials for this Owner
Home Financials are based on the most recent Mortgage that was taken out on this home.
Original Mortgage
$58,700
Interest Rate
8.64%
Mortgage Type
VA
Create a Home Valuation Report for This Property
The Home Valuation Report is an in-depth analysis detailing your home's value as well as a comparison with similar homes in the area
Home Values in the Area
Average Home Value in this Area
Purchase History
| Date | Buyer | Sale Price | Title Company |
|---|---|---|---|
| Red River Talents Llc | -- | Ruffolo John M | |
| 351 Stelton Llc | $88,500 | Chicago Title Company Llc | |
| Siwo Michael A | -- | Attorney | |
| Secretary Of Veterans Affairs | $32,000 | None Available | |
| Lewis George W | $57,000 | -- |
Source: Public Records
Mortgage History
| Date | Status | Borrower | Loan Amount |
|---|---|---|---|
| Previous Owner | Lewis George W | $58,700 |
Source: Public Records
Tax History Compared to Growth
Tax History
| Year | Tax Paid | Tax Assessment Tax Assessment Total Assessment is a certain percentage of the fair market value that is determined by local assessors to be the total taxable value of land and additions on the property. | Land | Improvement |
|---|---|---|---|---|
| 2024 | $983 | $22,970 | $4,640 | $18,330 |
| 2023 | $983 | $22,970 | $4,640 | $18,330 |
| 2022 | $882 | $17,590 | $3,710 | $13,880 |
| 2021 | $894 | $17,590 | $3,710 | $13,880 |
| 2020 | $857 | $17,590 | $3,710 | $13,880 |
| 2019 | $722 | $13,950 | $4,020 | $9,930 |
| 2018 | $725 | $13,950 | $4,020 | $9,930 |
| 2017 | $463 | $19,590 | $4,020 | $15,570 |
| 2016 | $463 | $8,750 | $4,020 | $4,730 |
| 2015 | $465 | $8,750 | $4,020 | $4,730 |
| 2014 | $445 | $8,750 | $4,020 | $4,730 |
Source: Public Records
Map
Nearby Homes
- 530 Cincinnati Ave
- 633 Xenia Ave
- 523 Newport Rd
- 453 Walnut St
- 100 Prugh Ave
- 293 S Miami Ave
- 46 Lake St
- 55 Lake St
- 305-325 Bellbrook Ave
- 400 S Detroit St
- 148 Home Ave
- 260 Pocahontas St
- 36 Leaman St
- 222 Washington St
- 75 W 2nd St
- 1208 Bellbrook Ave
- 1272 Bellbrook Ave
- 373 Hill St
- 0 W Church St
- 1342 Kylemore Dr
- 357 Stelton Rd
- 341 Stelton Rd Unit 709
- 341 Stelton Rd Unit 718
- 341 Stelton Rd
- 367 Stelton Rd
- 333 Stelton Rd
- 375 Stelton Rd
- 323 Stelton Rd
- 381 Stelton Rd
- 346 Stelton Rd
- 313 Stelton Rd
- 360 Stelton Rd
- 391 Stelton Rd
- 368 Stelton Rd
- 305 Stelton Rd
- 322 Stelton Rd
- 382 Stelton Rd
- 397 Stelton Rd
- 388 Stelton Rd
- 295 Stelton Rd