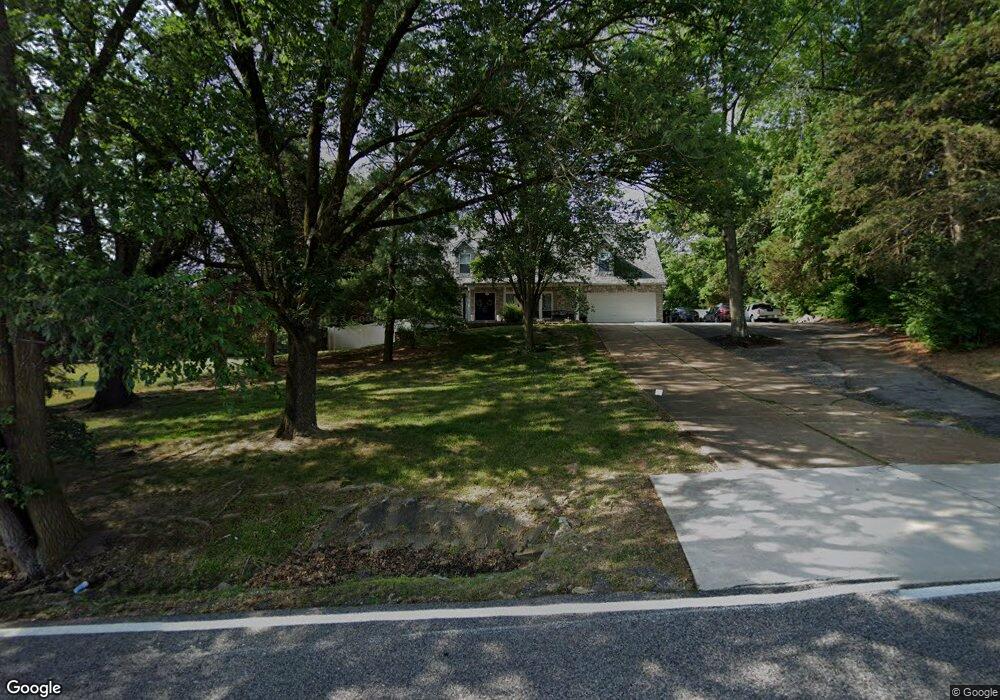
351 Summit Rd Fenton, MO 63026
Estimated Value: $432,000 - $544,000
4
Beds
3
Baths
2,706
Sq Ft
$182/Sq Ft
Est. Value
About This Home
This home is located at 351 Summit Rd, Fenton, MO 63026 and is currently estimated at $492,769, approximately $182 per square foot. 351 Summit Rd is a home located in St. Louis County with nearby schools including Concord Elementary School, Sperreng Middle School, and Lindbergh High School.
Ownership History
Date
Name
Owned For
Owner Type
Purchase Details
Closed on
Jun 10, 2020
Sold by
Fisher Lois M and Francis Lois M
Bought by
Francis Lois M
Current Estimated Value
Home Financials for this Owner
Home Financials are based on the most recent Mortgage that was taken out on this home.
Original Mortgage
$193,000
Outstanding Balance
$153,273
Interest Rate
3.1%
Mortgage Type
New Conventional
Estimated Equity
$339,496
Purchase Details
Closed on
Oct 21, 2013
Sold by
Fisher Gregory W and Fisher Lois M
Bought by
Fisher Gregory W and Fisher Lois M
Purchase Details
Closed on
Jun 19, 1998
Sold by
Bisbee Gerald L and Domalik Bisbee Sophie A
Bought by
Fisher Gregory W and Fisher Deanne R
Home Financials for this Owner
Home Financials are based on the most recent Mortgage that was taken out on this home.
Original Mortgage
$118,400
Interest Rate
6.5%
Create a Home Valuation Report for This Property
The Home Valuation Report is an in-depth analysis detailing your home's value as well as a comparison with similar homes in the area
Purchase History
| Date | Buyer | Sale Price | Title Company |
|---|---|---|---|
| Francis Lois M | -- | Copper Title Llc | |
| Fisher Gregory W | -- | None Available | |
| Fisher Gregory W | -- | First American Title |
Source: Public Records
Mortgage History
| Date | Status | Borrower | Loan Amount |
|---|---|---|---|
| Open | Francis Lois M | $193,000 | |
| Closed | Fisher Gregory W | $118,400 |
Source: Public Records
Tax History
| Year | Tax Paid | Tax Assessment Tax Assessment Total Assessment is a certain percentage of the fair market value that is determined by local assessors to be the total taxable value of land and additions on the property. | Land | Improvement |
|---|---|---|---|---|
| 2025 | $5,362 | $77,110 | $36,730 | $40,380 |
| 2024 | $5,362 | $75,050 | $23,240 | $51,810 |
| 2023 | $5,351 | $75,050 | $23,240 | $51,810 |
| 2022 | $4,809 | $64,830 | $23,240 | $41,590 |
| 2021 | $4,784 | $64,830 | $23,240 | $41,590 |
| 2020 | $4,437 | $58,020 | $16,300 | $41,720 |
| 2019 | $4,425 | $58,020 | $16,300 | $41,720 |
| 2018 | $4,335 | $53,150 | $12,450 | $40,700 |
| 2017 | $4,290 | $53,150 | $12,450 | $40,700 |
| 2016 | $3,613 | $44,770 | $10,740 | $34,030 |
Source: Public Records
Map
Nearby Homes
- 000 Gravois Summit
- 927 Gravois Rd
- 907 Oak Dr
- 831 Oak Dr
- 1230 Summit Meadows Dr
- 100 Orchid Dr Unit 100
- 91 Poppy Dr Unit 91
- 834 Young Dr
- 818 Mary Lee Ct
- 433 Summit Tree Ct
- 711 Mosely Ct
- 819 Horizon Ln
- 811 Mary Lee Ct
- 800 Mary Lee Ct
- 53 Lois Ln
- 1273 Green Falls Dr
- 63 Smoke Tree Dr
- 114 San Marino Pkwy
- 78 San Marino Pkwy
- 26 W Lakewood Dr
- 804 Arlington Glen Dr
- 345 Summit Rd
- 370 Summit Rd
- 808 Arlington Glen Dr
- 358 Summit Rd
- 866 Summit Bluff Ct
- 805 Arlington Glen Dr
- 348 Summit Rd
- 339 Summit Rd
- 372 Gravois Place
- 360 Gravois Place
- 812 Arlington Glen Dr
- 860 Summit Bluff Ct
- 867 Summit Bluff Ct
- 390 Summit Rd
- 813 Arlington Glen Dr
- 340 Summit Rd
- 863 Summit Bluff Ct
- 354 Gravois Place
- 816 Arlington Glen Dr
Your Personal Tour Guide
Ask me questions while you tour the home.