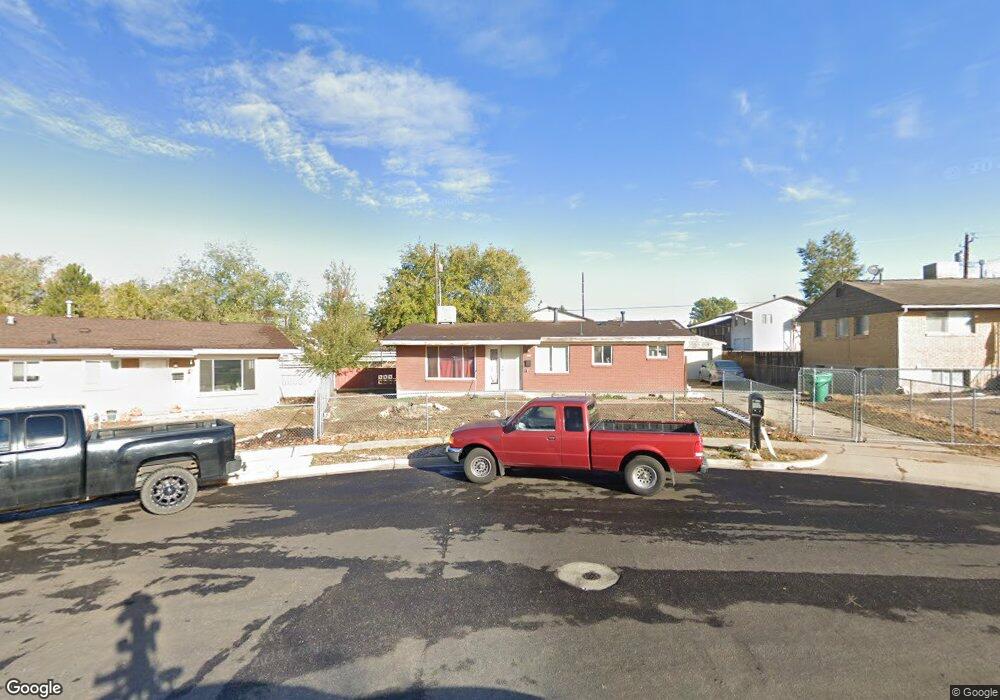
351 W 750 N Clearfield, UT 84015
Estimated Value: $349,150 - $362,000
4
Beds
2
Baths
1,212
Sq Ft
$294/Sq Ft
Est. Value
About This Home
This home is located at 351 W 750 N, Clearfield, UT 84015 and is currently estimated at $355,788, approximately $293 per square foot. 351 W 750 N is a home located in Davis County with nearby schools including Doxey Elementary School, North Davis Junior High School, and Clearfield High School.
Ownership History
Date
Name
Owned For
Owner Type
Purchase Details
Closed on
May 4, 2007
Sold by
Jp Morgan Chase Bank Na
Bought by
Gonzalez Eduardo and Gomez Isabel C
Current Estimated Value
Home Financials for this Owner
Home Financials are based on the most recent Mortgage that was taken out on this home.
Original Mortgage
$112,000
Outstanding Balance
$67,606
Interest Rate
6.12%
Mortgage Type
Purchase Money Mortgage
Estimated Equity
$288,182
Purchase Details
Closed on
Feb 13, 2007
Sold by
Elkins Ryan N
Bought by
Jpmorgan Chase Bank Na and Bear Stearns Alt-A Trust 2005-8
Purchase Details
Closed on
Jun 28, 2005
Sold by
Woodring Mark W and Woodring Shannon R
Bought by
Elkins Ryan
Home Financials for this Owner
Home Financials are based on the most recent Mortgage that was taken out on this home.
Original Mortgage
$92,800
Interest Rate
7.12%
Mortgage Type
Fannie Mae Freddie Mac
Create a Home Valuation Report for This Property
The Home Valuation Report is an in-depth analysis detailing your home's value as well as a comparison with similar homes in the area
Home Values in the Area
Average Home Value in this Area
Purchase History
| Date | Buyer | Sale Price | Title Company |
|---|---|---|---|
| Gonzalez Eduardo | -- | First American Title | |
| Jpmorgan Chase Bank Na | $97,879 | None Available | |
| Elkins Ryan | -- | -- |
Source: Public Records
Mortgage History
| Date | Status | Borrower | Loan Amount |
|---|---|---|---|
| Open | Gonzalez Eduardo | $112,000 | |
| Previous Owner | Elkins Ryan | $92,800 |
Source: Public Records
Tax History
| Year | Tax Paid | Tax Assessment Tax Assessment Total Assessment is a certain percentage of the fair market value that is determined by local assessors to be the total taxable value of land and additions on the property. | Land | Improvement |
|---|---|---|---|---|
| 2025 | $1,909 | $171,050 | $73,665 | $97,385 |
| 2024 | $1,852 | $167,200 | $70,417 | $96,783 |
| 2023 | $1,720 | $285,000 | $112,552 | $172,448 |
| 2022 | $1,737 | $155,651 | $64,433 | $91,218 |
| 2021 | $1,544 | $209,000 | $69,058 | $139,942 |
| 2020 | $1,331 | $179,000 | $58,200 | $120,800 |
| 2019 | $1,318 | $175,000 | $60,541 | $114,459 |
| 2018 | $1,175 | $152,000 | $51,049 | $100,951 |
| 2016 | $1,042 | $70,455 | $21,509 | $48,946 |
| 2015 | $997 | $64,240 | $21,509 | $42,731 |
| 2014 | $991 | $64,769 | $21,509 | $43,260 |
| 2013 | -- | $59,408 | $24,559 | $34,849 |
Source: Public Records
Map
Nearby Homes
Your Personal Tour Guide
Ask me questions while you tour the home.