
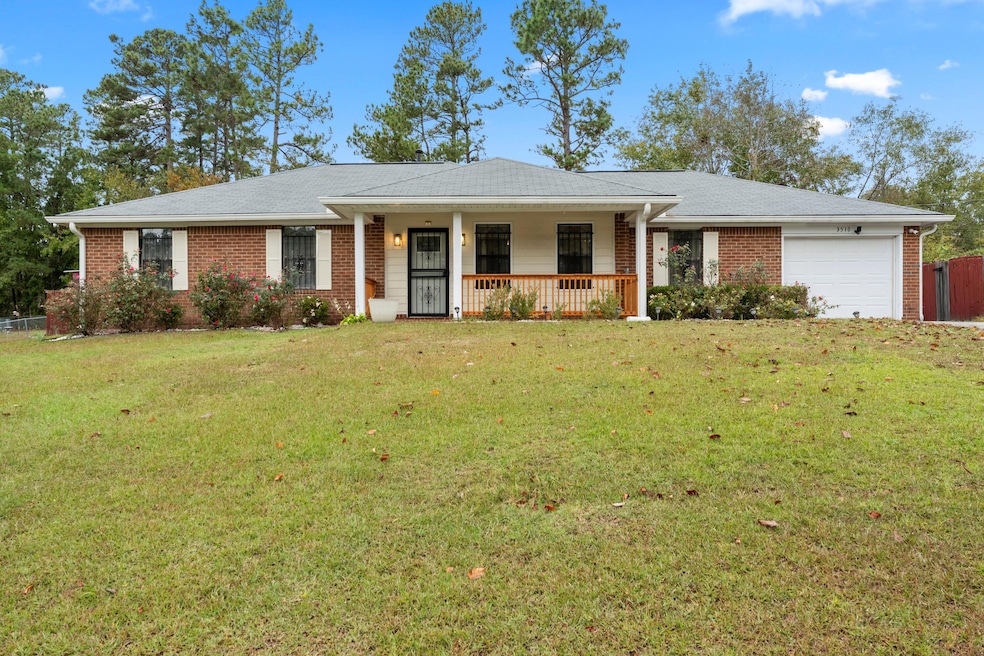
3510 Barker Dr Hephzibah, GA 30815
Jamestown NeighborhoodEstimated payment $1,327/month
Total Views
13,227
3
Beds
2
Baths
1,719
Sq Ft
$128
Price per Sq Ft
Highlights
- Very Popular Property
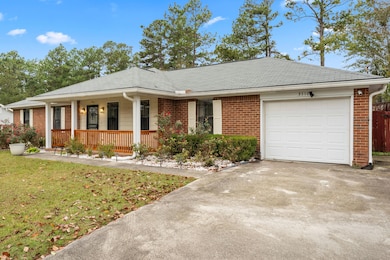
- Ranch Style House
- Sun or Florida Room
- Johnson Magnet Rated 10
- Wood Flooring
- No HOA
About This Home
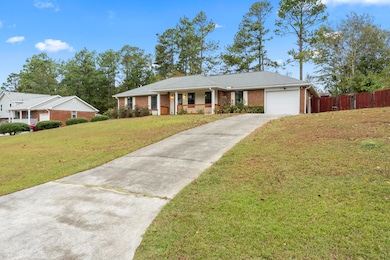
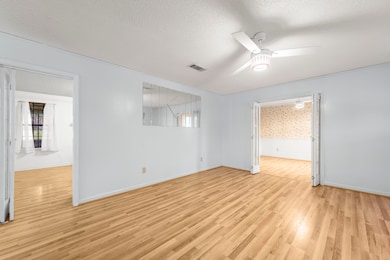
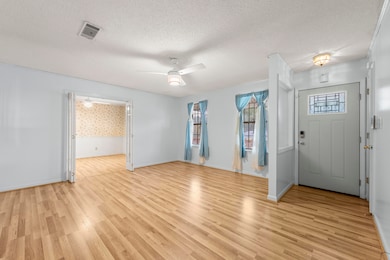
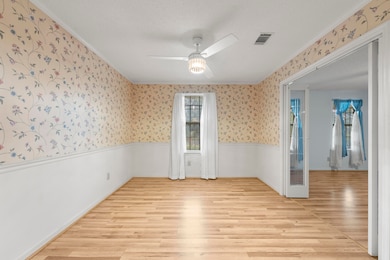
Welcome Home to 3510 Barker Drive!This 1level, 3 bedroom, 2 Bath home offers 1,719 sq ft of space on nearly a half acre. Inside you'll find an inviting layout featuring a spacious living room with plenty of natural light, a well equipped kitchen with lots of cabinet space, and a dining area perfect for family gatherings. The owners suite provides a peaceful retreat with a private bath, while the additional bedrooms are generously sized and versatile for guests, a home office, or hobbies. Enjoy outdoor living in the large backyard, ideal for relaxing, entertaining, or creating your dream garden. Tucked away on a peaceful street in Hephzibah, this home combines comfort, space, and convenience, just minutes from local schools, shopping, and Fort Gordon.Whether you're a first time home buyer or looking to downsize, this home is move-in ready and waiting for you!
Home Details
Home Type
- Single Family
Est. Annual Taxes
- $2,035
Year Built
- Built in 1988
Lot Details
- 0.44 Acre Lot
- Fenced
Parking
- 1 Car Garage
Home Design
- Ranch Style House
- Brick Exterior Construction
- Composition Roof
Interior Spaces
- 1,719 Sq Ft Home
- Ceiling Fan
- Gas Log Fireplace
- Brick Fireplace
- Entrance Foyer
- Family Room with Fireplace
- Living Room
- Dining Room
- Sun or Florida Room
- Wood Flooring
- Crawl Space
- Washer Hookup
Kitchen
- Eat-In Kitchen
- Dishwasher
Bedrooms and Bathrooms
- 3 Bedrooms
- 2 Full Bathrooms
Outdoor Features
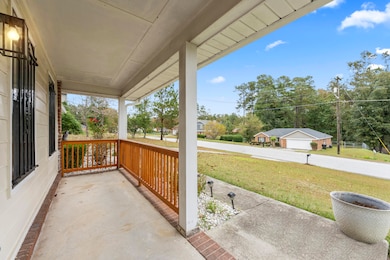
- Front Porch
Schools
- Deer Chase Elementary School
- Hephzibah Middle School
- Hephzibah Comp. High School
Utilities
- Central Air
- Heating System Uses Natural Gas
Community Details
- No Home Owners Association
Listing and Financial Details
- Assessor Parcel Number 1280163000
Map
Create a Home Valuation Report for This Property
The Home Valuation Report is an in-depth analysis detailing your home's value as well as a comparison with similar homes in the area
Home Values in the Area
Average Home Value in this Area
Tax History
| Year | Tax Paid | Tax Assessment Tax Assessment Total Assessment is a certain percentage of the fair market value that is determined by local assessors to be the total taxable value of land and additions on the property. | Land | Improvement |
|---|---|---|---|---|
| 2025 | $1,088 | $80,992 | $7,600 | $73,392 |
| 2024 | $1,088 | $76,192 | $7,600 | $68,592 |
| 2023 | $1,002 | $70,060 | $7,600 | $62,460 |
| 2022 | $919 | $55,532 | $7,600 | $47,932 |
| 2021 | $810 | $40,651 | $7,600 | $33,051 |
| 2020 | $814 | $40,651 | $7,600 | $33,051 |
| 2019 | $843 | $40,651 | $7,600 | $33,051 |
| 2018 | $847 | $40,651 | $7,600 | $33,051 |
| 2017 | $855 | $41,800 | $7,600 | $34,200 |
| 2016 | $855 | $41,800 | $7,600 | $34,200 |
| 2015 | $1,634 | $41,800 | $7,600 | $34,200 |
| 2014 | $1,485 | $38,490 | $7,600 | $30,890 |
Source: Public Records
Property History
| Date | Event | Price | List to Sale | Price per Sq Ft |
|---|---|---|---|---|
| 10/30/2025 10/30/25 | For Sale | $220,000 | -- | $128 / Sq Ft |
Source: REALTORS® of Greater Augusta
Purchase History
| Date | Type | Sale Price | Title Company |
|---|---|---|---|
| Deed | -- | -- | |
| Deed | $84,900 | -- | |
| Deed | -- | -- | |
| Deed | -- | -- | |
| Deed | -- | -- | |
| Deed | $510,000 | -- | |
| Deed | -- | -- |
Source: Public Records
About the Listing Agent
Are you thinking about buying or selling? Let’s talk about it. Sheena Harrison your, Personal Care Real Estate Agent
If you are looking for real estate guidance with consistent and clear communication, I am here to help you. I provide exceptional personalized service for all my clients and take great pride in the relationships I build. I always work relentlessly on my clients behalf to help them achieve their real estate goals. I ensure you have a clear understanding of the market and that
Sheena's Other Listings
Source: REALTORS® of Greater Augusta
MLS Number: 548763
APN: 1280163000
Disclaimer: Certain information contained herein is derived from information provided by parties other than Homes.com. All information provided is deemed reliable, but is not guaranteed to be accurate and should be independently verified.
![]() IDX information is provided exclusively for personal, non-commercial use, and may not be used for any purpose other than to identify prospective properties consumers may be interested in purchasing.
IDX information is provided exclusively for personal, non-commercial use, and may not be used for any purpose other than to identify prospective properties consumers may be interested in purchasing.
Information is deemed reliable but not guaranteed.
Nearby Homes
- 3747 Crest Dr
- 2949 Arrowwood Cir
- 2712 Fair Oak Ct
- 407 Woodhazel Way
- 3821 Crest Dr
- 2535 Sand Ridge Ct
- 2859 Pepperdine Dr
- 3024 Thornhill Dr
- 3326 Saddlebrook Dr
- 2877 Pepperdine Dr
- 4386 Creekview Dr
- 3409 Saddle Horn Run
- 2813 Ridgecrest Dr
- 4358 Creekview Dr
- 3753 Woodcock Dr
- 3602 Pebble Creek Dr
- 3603 Pebble Creek Dr
- 4004 Rambling Way
- 3621 Pebble Creek Dr
- 3623 Pebble Creek Dr
- 3422 Nance Blvd
- 203 Williamsburg Dr
- 2714 Fair Oak Ct
- 3815 Crest Dr
- 2848 Pepperdine Dr
- 3319 Saddlebrook Dr
- 3502 Sidesaddle Ct
- 4309 Creekview Dr
- 4011 Pinnacle Way
- 1733 Ethan Way
- 2825 Crosscreek Rd
- 1764 Deer Chase Ln
- 3019 White Sand Dr
- 3538 Firestone Dr
- 2714 Cranbrook Dr
- 4330 Newland St
- 3417 Knollcrest Rd
- 2556 Spirit Creek Rd
- 1327 Apache Trail
- 3409 Knollcrest Rd