3510 E Main St Bridgeport, CT 06610
North Bridgeport NeighborhoodEstimated Value: $412,000 - $461,000
3
Beds
2
Baths
1,870
Sq Ft
$237/Sq Ft
Est. Value
About This Home
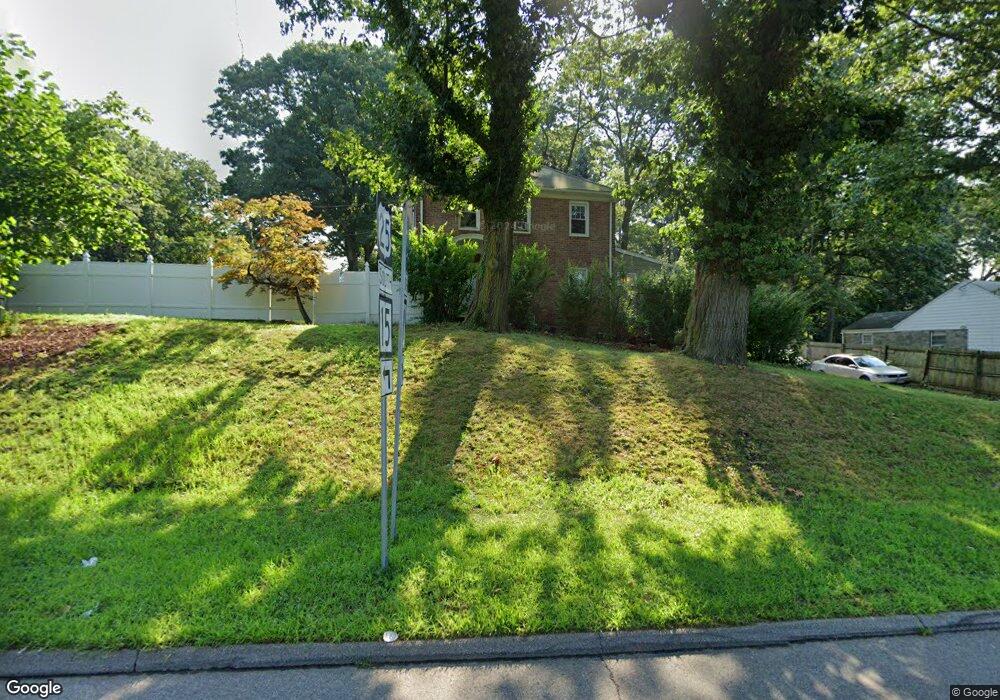
This home is located at 3510 E Main St, Bridgeport, CT 06610 and is currently estimated at $442,828, approximately $236 per square foot. 3510 E Main St is a home located in Fairfield County with nearby schools including Hooker School, Harding High School, and Achievement First Bridgeport Academy Elementary School.
Ownership History
Date
Name
Owned For
Owner Type
Purchase Details
Closed on
May 2, 2011
Sold by
Hsbc Bk Usa Ne Na
Bought by
New England Home Dev L
Current Estimated Value
Home Financials for this Owner
Home Financials are based on the most recent Mortgage that was taken out on this home.
Original Mortgage
$140,000
Outstanding Balance
$95,003
Interest Rate
4.76%
Estimated Equity
$347,825
Purchase Details
Closed on
Mar 2, 2010
Sold by
Sanabria Jose
Bought by
Hsbc Bank Usa
Purchase Details
Closed on
Aug 9, 2004
Sold by
Abreu Renato
Bought by
Sanabria Abdul
Purchase Details
Closed on
Oct 26, 1995
Sold by
Alaska Seaboard Lp
Bought by
Abreau Renato M
Purchase Details
Closed on
Feb 10, 1989
Sold by
Mata Joseph
Bought by
Webster Ina
Create a Home Valuation Report for This Property
The Home Valuation Report is an in-depth analysis detailing your home's value as well as a comparison with similar homes in the area
Home Values in the Area
Average Home Value in this Area
Purchase History
We collect this data history from publicly available records. To have your information removed, we recommend requesting removal directly through your county’s website.
| Date | Buyer | Sale Price | Title Company |
|---|---|---|---|
| New England Home Dev L | $105,000 | -- | |
| New England Home Dev L | $105,000 | -- | |
| Hsbc Bank Usa | -- | -- | |
| Hsbc Bank Usa | -- | -- | |
| Sanabria Abdul | $247,000 | -- | |
| Sanabria Abdul | $247,000 | -- | |
| Abreau Renato M | $72,000 | -- | |
| Alaska Seaboard Lp | $45,963 | -- | |
| Alaska Seaboard Lp | $45,963 | -- | |
| Webster Ina | $170,000 | -- |
Source: Public Records
Mortgage History
We collect this data history from publicly available records. To have your information removed, we recommend requesting removal directly through your county’s website.
| Date | Status | Borrower | Loan Amount |
|---|---|---|---|
| Open | Webster Ina | $140,000 | |
| Closed | Webster Ina | $140,000 |
Source: Public Records
Tax History
| Year | Tax Paid | Tax Assessment Tax Assessment Total Assessment is a certain percentage of the fair market value that is determined by local assessors to be the total taxable value of land and additions on the property. | Land | Improvement |
|---|---|---|---|---|
| 2025 | $7,282 | $167,604 | $54,604 | $113,000 |
| 2024 | $7,282 | $167,604 | $54,604 | $113,000 |
| 2023 | $7,282 | $167,604 | $54,604 | $113,000 |
| 2022 | $7,282 | $167,604 | $54,604 | $113,000 |
| 2021 | $7,282 | $167,604 | $54,604 | $113,000 |
| 2020 | $7,951 | $147,270 | $48,220 | $99,050 |
| 2019 | $7,951 | $147,270 | $48,220 | $99,050 |
| 2018 | $8,007 | $147,270 | $48,220 | $99,050 |
| 2017 | $8,007 | $147,270 | $48,220 | $99,050 |
| 2016 | $8,007 | $147,270 | $48,220 | $99,050 |
| 2015 | $6,966 | $165,070 | $45,770 | $119,300 |
| 2014 | $6,966 | $165,070 | $45,770 | $119,300 |
Source: Public Records
Map
Nearby Homes
- 11 Beverly Dr
- 104 Oakdale St
- 437 Huntington Turnpike
- 217 Hillcrest Rd
- 265 Jennings Ave
- 109 Barclay St
- 156 Dayton Rd
- 74 Hollywood Ave
- 65 Westmere St
- 100 Oakridge Rd
- 20 Oakridge Rd
- 110 Greystone Rd
- 150 Trumbull Ave
- 147 Trumbull Ave
- 9 Round Hill Rd
- 625 Evers St
- 170 Huntington Turnpike
- 891 Evers Street Extension
- 182 Trumbull Ave
- 12 Court c Unit Bdlg 61
- 42 Broadbridge Rd
- 3500 E Main St
- 50 Broadbridge Rd
- 3456 E Main St
- 60 Broadbridge Rd
- 3430 E Main St
- 25 Trojan Dr
- 104 Broadbridge Rd
- 7 Trojan Dr
- 39 Trojan Dr
- 49 Trojan Dr
- 61 Trojan Dr
- 3390 E Main St
- 85 Trojan Dr
- 34 Trojan Dr
- 44 Trojan Dr
- 130 Broadbridge Rd
- 3380 E Main St
- 140 Broadbridge Rd
- 91 Trojan Dr
Your Personal Tour Guide
Ask me questions while you tour the home.