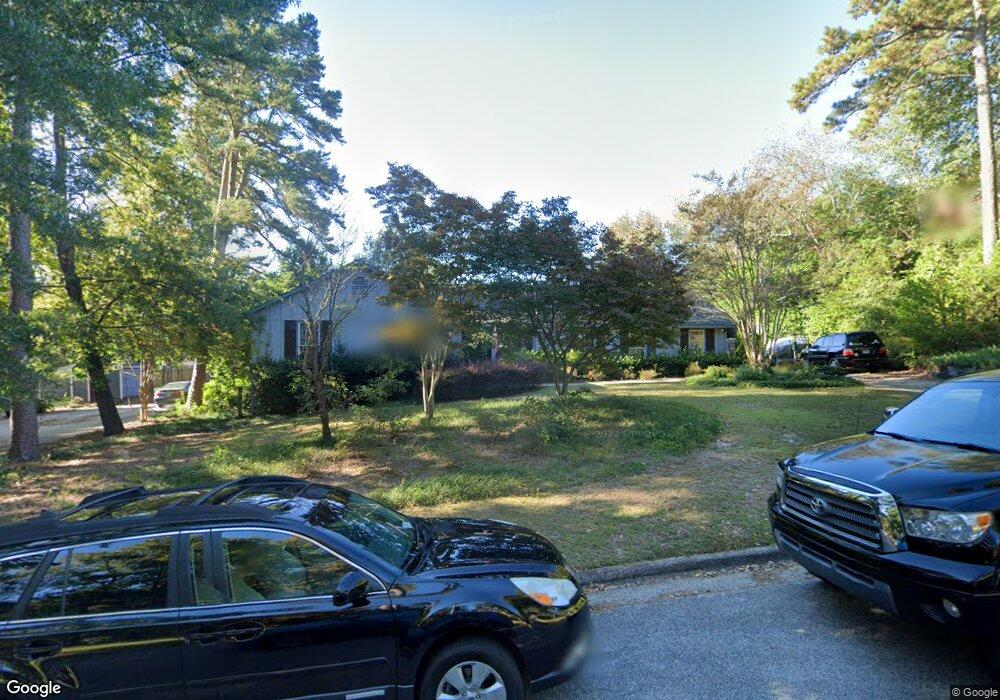
3510 Gloucester Ct Augusta, GA 30907
Estimated Value: $328,000 - $406,000
4
Beds
3
Baths
2,305
Sq Ft
$156/Sq Ft
Est. Value
About This Home
This home is located at 3510 Gloucester Ct, Augusta, GA 30907 and is currently estimated at $359,510, approximately $155 per square foot. 3510 Gloucester Ct is a home located in Columbia County with nearby schools including Stevens Creek Elementary School, Stallings Island Middle School, and Lakeside High School.
Ownership History
Date
Name
Owned For
Owner Type
Purchase Details
Closed on
May 29, 2020
Sold by
Hedrick James Garson
Bought by
Hedrick James Garson and Hedrick Shelley Powell
Current Estimated Value
Home Financials for this Owner
Home Financials are based on the most recent Mortgage that was taken out on this home.
Original Mortgage
$176,500
Outstanding Balance
$120,857
Interest Rate
3.2%
Mortgage Type
New Conventional
Estimated Equity
$238,653
Purchase Details
Closed on
Sep 13, 2016
Sold by
Crumbly Chad W and Crumbly Jennifer P
Bought by
Hedrick James Garson
Home Financials for this Owner
Home Financials are based on the most recent Mortgage that was taken out on this home.
Original Mortgage
$211,105
Interest Rate
3.5%
Mortgage Type
FHA
Create a Home Valuation Report for This Property
The Home Valuation Report is an in-depth analysis detailing your home's value as well as a comparison with similar homes in the area
Home Values in the Area
Average Home Value in this Area
Purchase History
| Date | Buyer | Sale Price | Title Company |
|---|---|---|---|
| Hedrick James Garson | -- | -- | |
| Hedrick James Garson | $215,000 | -- |
Source: Public Records
Mortgage History
| Date | Status | Borrower | Loan Amount |
|---|---|---|---|
| Open | Hedrick James Garson | $176,500 | |
| Previous Owner | Hedrick James Garson | $211,105 |
Source: Public Records
Tax History
| Year | Tax Paid | Tax Assessment Tax Assessment Total Assessment is a certain percentage of the fair market value that is determined by local assessors to be the total taxable value of land and additions on the property. | Land | Improvement |
|---|---|---|---|---|
| 2025 | $3,107 | $129,812 | $25,204 | $104,608 |
| 2024 | $2,913 | $116,187 | $21,304 | $94,883 |
| 2023 | $2,913 | $115,349 | $20,604 | $94,745 |
| 2022 | $2,843 | $109,112 | $21,204 | $87,908 |
| 2021 | $2,800 | $102,789 | $17,204 | $85,585 |
| 2020 | $2,609 | $93,805 | $15,404 | $78,401 |
| 2019 | $2,688 | $96,640 | $18,804 | $77,836 |
| 2018 | $2,454 | $87,894 | $18,804 | $69,090 |
| 2017 | $2,409 | $86,000 | $14,604 | $71,396 |
| 2016 | $2,257 | $81,560 | $14,080 | $67,480 |
| 2015 | $2,122 | $76,405 | $13,880 | $62,525 |
| 2014 | $2,173 | $77,307 | $16,480 | $60,827 |
Source: Public Records
Map
Nearby Homes
- 345 Old Salem Way
- 309 Old Salem Way
- 304 Old Salem Way
- 316 Wakefield Ln N
- 248 Watervale Rd
- 414 Parliament Rd
- 3658 Marlboro St
- 3667 Foxfire Place
- 705 Cool Brook Ct
- 716 Cool Brook Dr
- 315 Rabun Valley Ln
- 4120 Shady Oaks Dr
- 308 Valhalla Ct
- 719 Gentlewind Ln
- 412 Hastings Place
- 1123 Hampstead Place
- 417 Preserve Trail
- 816 Brookfield Pkwy
- 320 Furys Ferry Rd
- 429 Wexford Ct
- 3508 Gloucester Ct
- 3512 Gloucester Ct
- 284 Highlands Ln
- 3509 Gloucester Ct
- 282 Highlands Ln
- 286 Highlands Ln
- 3514 Gloucester Ct
- 298 Wakefield Ln S
- 3511 Gloucester Ct
- 280 Highlands Ln
- 288 Wakefield Ln S
- 294 Wakefield Ln S
- 302 Wakefield Ln N
- 288 Wakefield Ln N
- 306 Gloucester Rd
- 3515 Gloucester Ct
- 278 Highlands Ln
- 3513 Gloucester Ct
- 304 Wakefield Ln N
- 308 Gloucester Rd
Your Personal Tour Guide
Ask me questions while you tour the home.