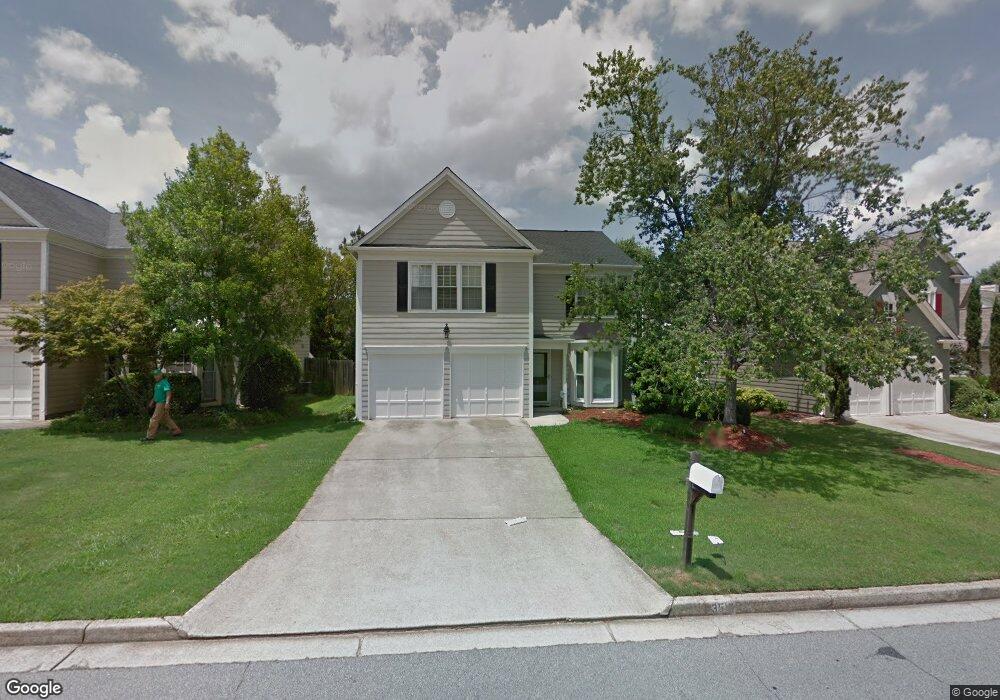
3510 Patterstone Dr Unit 1 Alpharetta, GA 30022
Newtown NeighborhoodEstimated Value: $568,000 - $607,000
3
Beds
3
Baths
2,257
Sq Ft
$258/Sq Ft
Est. Value
About This Home
This home is located at 3510 Patterstone Dr Unit 1, Alpharetta, GA 30022 and is currently estimated at $582,008, approximately $257 per square foot. 3510 Patterstone Dr Unit 1 is a home located in Fulton County with nearby schools including Barnwell Elementary School, Autrey Mill Middle School, and Johns Creek High School.
Ownership History
Date
Name
Owned For
Owner Type
Purchase Details
Closed on
Jul 27, 2006
Sold by
United Guaranty Residl Ins Co
Bought by
Pantlitz Michael A
Current Estimated Value
Home Financials for this Owner
Home Financials are based on the most recent Mortgage that was taken out on this home.
Original Mortgage
$215,000
Outstanding Balance
$128,521
Interest Rate
6.68%
Mortgage Type
New Conventional
Estimated Equity
$453,487
Purchase Details
Closed on
Nov 16, 2005
Sold by
Federal National Mortgage Association
Bought by
Citimortgage Inc
Purchase Details
Closed on
Sep 6, 2005
Sold by
Citimortgage Inc
Bought by
United Guaranty Residl Ins Co
Purchase Details
Closed on
Apr 16, 2002
Sold by
Gallagher Kathy J
Bought by
Morris Kimberlie T
Home Financials for this Owner
Home Financials are based on the most recent Mortgage that was taken out on this home.
Original Mortgage
$158,400
Interest Rate
6.89%
Mortgage Type
New Conventional
Create a Home Valuation Report for This Property
The Home Valuation Report is an in-depth analysis detailing your home's value as well as a comparison with similar homes in the area
Home Values in the Area
Average Home Value in this Area
Purchase History
| Date | Buyer | Sale Price | Title Company |
|---|---|---|---|
| Pantlitz Michael A | $215,000 | -- | |
| Citimortgage Inc | -- | -- | |
| United Guaranty Residl Ins Co | -- | -- | |
| Federal National Mortgage Association | -- | -- | |
| Citimortgage Inc | $206,100 | -- | |
| Morris Kimberlie T | $198,000 | -- |
Source: Public Records
Mortgage History
| Date | Status | Borrower | Loan Amount |
|---|---|---|---|
| Open | Pantlitz Michael A | $215,000 | |
| Previous Owner | Morris Kimberlie T | $158,400 |
Source: Public Records
Tax History Compared to Growth
Tax History
| Year | Tax Paid | Tax Assessment Tax Assessment Total Assessment is a certain percentage of the fair market value that is determined by local assessors to be the total taxable value of land and additions on the property. | Land | Improvement |
|---|---|---|---|---|
| 2025 | $2,855 | $223,320 | $46,200 | $177,120 |
| 2023 | $5,774 | $204,560 | $43,000 | $161,560 |
| 2022 | $2,728 | $161,280 | $32,000 | $129,280 |
| 2021 | $2,692 | $136,680 | $28,880 | $107,800 |
| 2020 | $2,702 | $124,360 | $26,000 | $98,360 |
| 2019 | $326 | $126,480 | $25,880 | $100,600 |
| 2018 | $3,129 | $115,120 | $25,200 | $89,920 |
| 2017 | $2,672 | $90,680 | $22,160 | $68,520 |
| 2016 | $2,594 | $89,720 | $22,160 | $67,560 |
| 2015 | $2,642 | $90,320 | $22,160 | $68,160 |
| 2014 | $2,386 | $80,680 | $20,440 | $60,240 |
Source: Public Records
Map
Nearby Homes
- 10000 Barston Ct
- 510 Weatherend Ct
- 320 Outwood Mill Ct
- 3705 Patterstone Dr
- 201 Downing Dr Unit 76
- 10090 Jones Bridge Rd Unit 8
- 615 S Preston Ct
- 130 Forrest View Terrace
- 595 Oak Alley Way
- 10085 Old Woodland Entry
- 120 Thome Dr
- 385 Birch Rill Dr
- 9715 Almaviva Dr
- 3273 Long Indian Creek Ct
- 3077 Haynes Trail
- 10421 Park Walk Point
- 9675 Almaviva Dr
- 545 Oak Bridge Trail
- 515 Oak Bridge Trail
- 10505 Ash Rill Dr
- 3500 Patterstone Dr
- 3520 Patterstone Dr
- 3530 Patterstone Dr Unit 1
- 555 Rosedown Way
- 565 Rosedown Way
- 565 Rosedown Way Unit 2
- 545 Rosedown Way
- 575 Rosedown Way
- 3480 Patterstone Dr Unit 1
- 3480 Patterstone Dr
- 3540 Patterstone Dr
- 3525 Patterstone Dr
- 3515 Patterstone Dr
- 535 Rosedown Way Unit II
- 585 Rosedown Way
- 3545 Patterstone Dr
- 3505 Patterstone Dr Unit 1
- 3550 Patterstone Dr
- 525 Rosedown Way
- 595 Rosedown Way