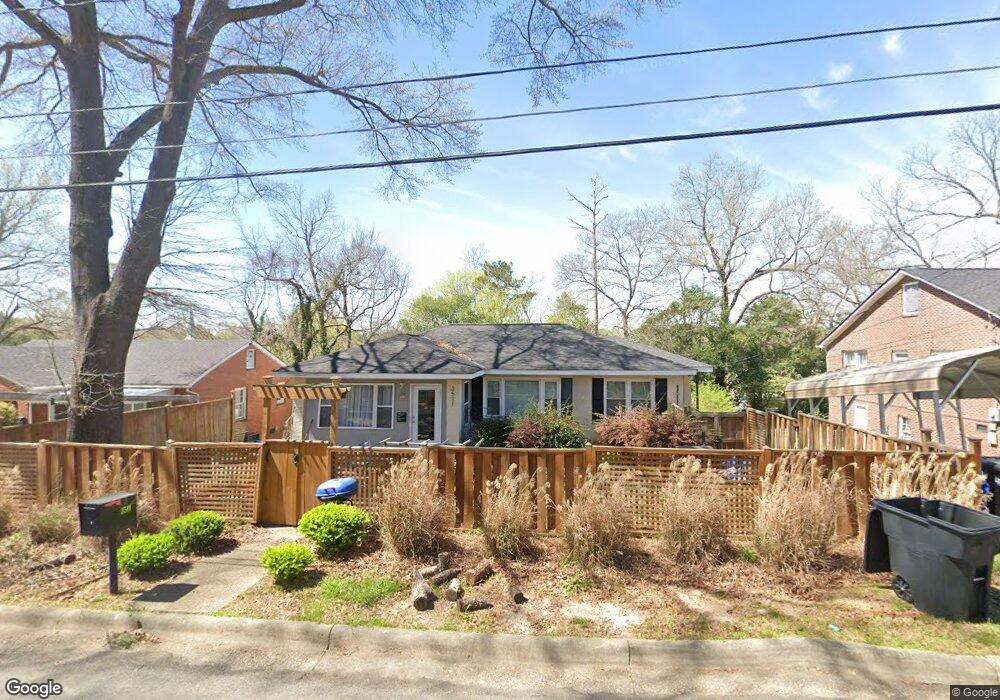
3511 18th Ave Columbus, GA 31904
Estimated Value: $136,000 - $143,305
3
Beds
1
Bath
2,261
Sq Ft
$62/Sq Ft
Est. Value
About This Home
This home is located at 3511 18th Ave, Columbus, GA 31904 and is currently estimated at $139,326, approximately $61 per square foot. 3511 18th Ave is a home located in Muscogee County with nearby schools including Johnson Elementary School, Richards Middle School, and Jordan Vocational High School.
Ownership History
Date
Name
Owned For
Owner Type
Purchase Details
Closed on
Jul 1, 2025
Sold by
Georgia Housing And Finance Authority
Bought by
Dharma Investments Llc
Current Estimated Value
Purchase Details
Closed on
Aug 16, 2016
Sold by
Whitman David L and Whitman Shirley
Bought by
Jordan Theresa and Jordan Thomas
Home Financials for this Owner
Home Financials are based on the most recent Mortgage that was taken out on this home.
Original Mortgage
$68,633
Interest Rate
3.75%
Mortgage Type
FHA
Purchase Details
Closed on
Apr 5, 2013
Sold by
Jones Ronald M
Bought by
Whitman David L and Whitman Shirley
Purchase Details
Closed on
Mar 28, 2012
Sold by
Ld Real Estate Investment
Bought by
Jones Ronald M
Purchase Details
Closed on
Mar 14, 2012
Sold by
Us Department Of Housing A
Bought by
Ld Real Estate Investment Hold
Purchase Details
Closed on
Mar 1, 2011
Sold by
Chase Home Finance Llc
Bought by
Sec Of Housing & Urban
Create a Home Valuation Report for This Property
The Home Valuation Report is an in-depth analysis detailing your home's value as well as a comparison with similar homes in the area
Home Values in the Area
Average Home Value in this Area
Purchase History
| Date | Buyer | Sale Price | Title Company |
|---|---|---|---|
| Dharma Investments Llc | $55,196 | None Listed On Document | |
| Jordan Theresa | $69,900 | -- | |
| Whitman David L | $72,500 | -- | |
| Jones Ronald M | $36,000 | -- | |
| Ld Real Estate Investment Hold | -- | -- | |
| Sec Of Housing & Urban | $63,419 | -- | |
| Chase Home Finance Llc | $75,323 | -- |
Source: Public Records
Mortgage History
| Date | Status | Borrower | Loan Amount |
|---|---|---|---|
| Previous Owner | Jordan Theresa | $68,633 |
Source: Public Records
Tax History Compared to Growth
Tax History
| Year | Tax Paid | Tax Assessment Tax Assessment Total Assessment is a certain percentage of the fair market value that is determined by local assessors to be the total taxable value of land and additions on the property. | Land | Improvement |
|---|---|---|---|---|
| 2025 | $1,761 | $44,988 | $8,264 | $36,724 |
| 2024 | -- | $44,988 | $8,264 | $36,724 |
| 2023 | $5 | $44,988 | $8,264 | $36,724 |
| 2022 | $264 | $36,764 | $8,264 | $28,500 |
| 2021 | $264 | $34,220 | $8,264 | $25,956 |
| 2020 | $264 | $34,220 | $8,264 | $25,956 |
| 2019 | $265 | $34,220 | $8,264 | $25,956 |
| 2018 | $265 | $34,220 | $8,264 | $25,956 |
| 2017 | $266 | $27,960 | $6,800 | $21,160 |
| 2016 | $1,196 | $29,000 | $3,750 | $25,250 |
| 2015 | $1,198 | $29,000 | $3,750 | $25,250 |
| 2014 | $480 | $29,000 | $3,750 | $25,250 |
| 2013 | -- | $29,345 | $3,750 | $25,595 |
Source: Public Records
Map
Nearby Homes
- 1703 39th St
- 3643 Calvin Dr
- 1702 40th St
- 1918 Rosemont Dr
- 3905 Crestview Dr
- 0 Warm Springs Rd
- 3305 Cherokee Ave
- 4109 Sherwood Ave
- 3248 Cherokee Ave
- 3105 Woodlawn Ave
- 1810 Shannon Dr
- 1717 42nd St
- 1719 Slade Dr
- 3232 Hillside Way
- 4220 18th Ave
- 2122 40th St
- 2257 Camille Dr
- 3111 15th Ave
- 2012 42nd St
- 4213 16th Ave