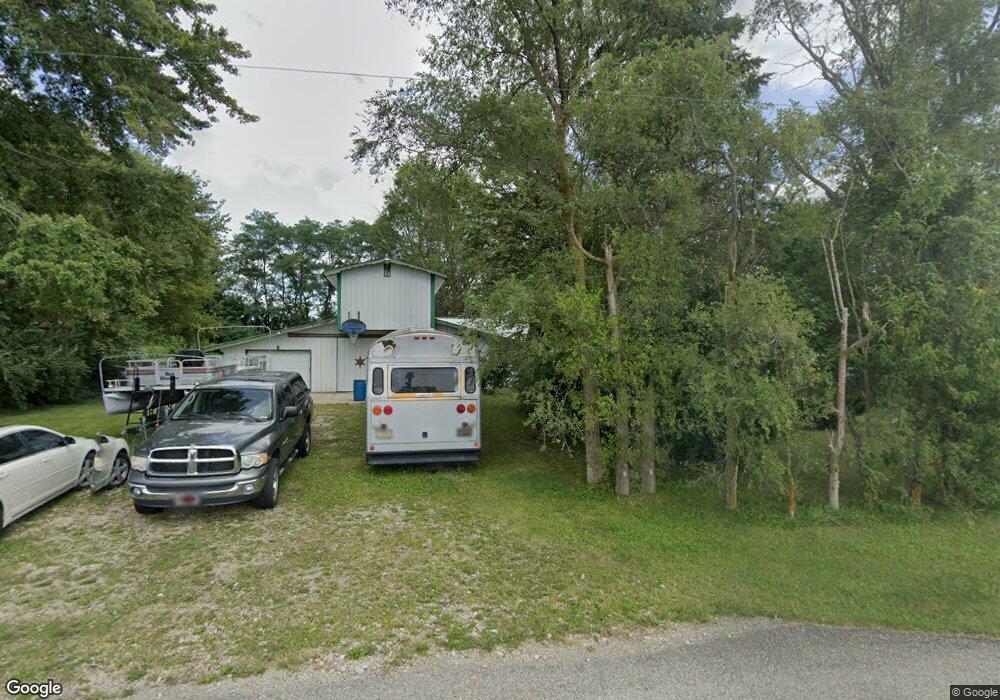
3511 N 450 E Greenfield, IN 46140
Estimated Value: $170,000 - $456,000
4
Beds
2
Baths
2,645
Sq Ft
$126/Sq Ft
Est. Value
About This Home
This home is located at 3511 N 450 E, Greenfield, IN 46140 and is currently estimated at $332,489, approximately $125 per square foot. 3511 N 450 E is a home located in Hancock County with nearby schools including Maxwell Intermediate School, Eden Elementary School, and Greenfield Central Junior High School.
Ownership History
Date
Name
Owned For
Owner Type
Purchase Details
Closed on
Oct 29, 2009
Sold by
Fannie Mae
Bought by
Smith Benjamin F
Current Estimated Value
Home Financials for this Owner
Home Financials are based on the most recent Mortgage that was taken out on this home.
Original Mortgage
$77,769
Outstanding Balance
$49,820
Interest Rate
5.11%
Mortgage Type
FHA
Estimated Equity
$282,669
Purchase Details
Closed on
Feb 12, 2009
Sold by
Bary John B
Bought by
Fannie Mae
Create a Home Valuation Report for This Property
The Home Valuation Report is an in-depth analysis detailing your home's value as well as a comparison with similar homes in the area
Purchase History
| Date | Buyer | Sale Price | Title Company |
|---|---|---|---|
| Smith Benjamin F | -- | -- | |
| Fannie Mae | $107,672 | -- |
Source: Public Records
Mortgage History
| Date | Status | Borrower | Loan Amount |
|---|---|---|---|
| Open | Smith Benjamin F | $77,769 |
Source: Public Records
Tax History
| Year | Tax Paid | Tax Assessment Tax Assessment Total Assessment is a certain percentage of the fair market value that is determined by local assessors to be the total taxable value of land and additions on the property. | Land | Improvement |
|---|---|---|---|---|
| 2025 | $3,115 | $212,600 | $59,300 | $153,300 |
| 2024 | $3,115 | $204,800 | $59,300 | $145,500 |
| 2023 | $3,134 | $189,800 | $59,300 | $130,500 |
| 2022 | $954 | $139,800 | $33,900 | $105,900 |
| 2021 | $772 | $118,300 | $33,900 | $84,400 |
| 2020 | $757 | $114,700 | $33,900 | $80,800 |
| 2019 | $713 | $110,500 | $33,900 | $76,600 |
| 2018 | $721 | $110,100 | $33,900 | $76,200 |
| 2017 | $703 | $107,400 | $33,900 | $73,500 |
| 2016 | $639 | $101,500 | $33,600 | $67,900 |
| 2014 | $592 | $99,500 | $32,600 | $66,900 |
| 2013 | $592 | $99,500 | $32,600 | $66,900 |
Source: Public Records
Map
Nearby Homes
- 3513 N 300 E
- 1380 Fairmount Dr
- 1751 Moss Landing Ln
- 1643 Colorado Spruce Way
- 1631 Colorado Spruce Way
- 1616 Colorado Spruce Way
- 2415 Fir Dr
- 2403 Fir Dr
- 2345 Fir Dr
- 2420 Fir Dr
- 2331 Fir Dr
- 1624 Hemlock Cir
- 2412 Fir Dr
- 2220 Foothill Dr
- 2065 Frost Line Ln
- 2053 Frost Line Ln
- 2021 Frost Line Ln
- 2054 Frost Line Ln
- 1633 Clover Crossing Dr
- 1621 Clover Crossing Dr
- 3564 N 450 E
- 3883 N 450 E
- 4478 E 300 N
- 4522 E 300 N
- 0 E 400 N Unit MBR2862640
- 0 E 400 N Unit 2802359
- 0 E 400 N Unit 2862640
- 0 E 400 N Unit 21230859
- 0 E 400 N Unit MBR2462509
- 0 E 400 N Unit MBR2335920
- 0 E 300 N Unit MBR2909983
- 4456 E 400 N
- 3359 N 400 E
- 4543 E 300 N
- 4565 E 300 N
- 3951 E 400 N
- 4589 E 300 N
- 3719 N 400 E
- 4294 E 300 N
- 4501 E 300 N
Your Personal Tour Guide
Ask me questions while you tour the home.