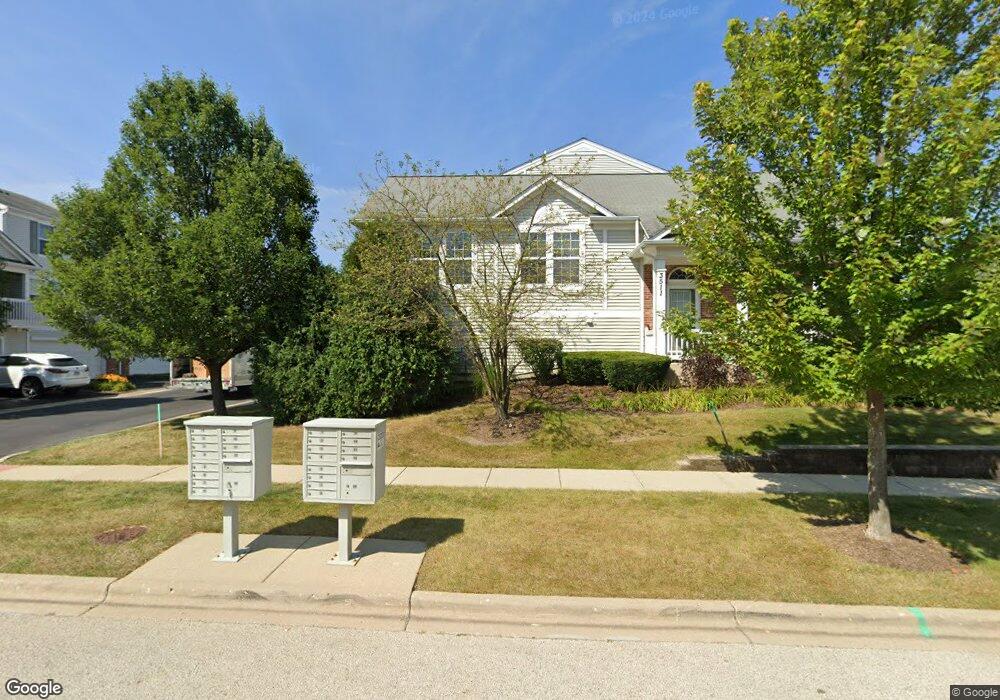
3511 Neubauer Cir Unit 21 Lindenhurst, IL 60046
Estimated Value: $275,000 - $302,000
2
Beds
3
Baths
1,704
Sq Ft
$169/Sq Ft
Est. Value
About This Home
This home is located at 3511 Neubauer Cir Unit 21, Lindenhurst, IL 60046 and is currently estimated at $288,568, approximately $169 per square foot. 3511 Neubauer Cir Unit 21 is a home located in Lake County with nearby schools including Millburn Elementary School, Millburn Middle School, and Lakes Community High School.
Ownership History
Date
Name
Owned For
Owner Type
Purchase Details
Closed on
Jul 26, 2017
Sold by
Eickhoff Brent D and Eickhoff Bridget A
Bought by
Baccia Frank and Baccia Minh
Current Estimated Value
Purchase Details
Closed on
Aug 13, 2008
Sold by
Pulte Home Corp
Bought by
Eickhoff Brent D and Wilcox Bridget A
Home Financials for this Owner
Home Financials are based on the most recent Mortgage that was taken out on this home.
Original Mortgage
$211,114
Interest Rate
6.66%
Mortgage Type
FHA
Purchase Details
Closed on
Jul 28, 2008
Sold by
Pulte Home Corp
Bought by
Makarla Kamalakar
Home Financials for this Owner
Home Financials are based on the most recent Mortgage that was taken out on this home.
Original Mortgage
$211,114
Interest Rate
6.66%
Mortgage Type
FHA
Create a Home Valuation Report for This Property
The Home Valuation Report is an in-depth analysis detailing your home's value as well as a comparison with similar homes in the area
Home Values in the Area
Average Home Value in this Area
Purchase History
| Date | Buyer | Sale Price | Title Company |
|---|---|---|---|
| Baccia Frank | $182,500 | Chicago Title | |
| Eickhoff Brent D | $215,000 | None Available | |
| Makarla Kamalakar | $213,500 | None Available |
Source: Public Records
Mortgage History
| Date | Status | Borrower | Loan Amount |
|---|---|---|---|
| Previous Owner | Eickhoff Brent D | $211,114 | |
| Previous Owner | Makarla Kamalakar | $170,792 |
Source: Public Records
Tax History Compared to Growth
Tax History
| Year | Tax Paid | Tax Assessment Tax Assessment Total Assessment is a certain percentage of the fair market value that is determined by local assessors to be the total taxable value of land and additions on the property. | Land | Improvement |
|---|---|---|---|---|
| 2024 | $6,076 | $79,251 | $11,539 | $67,712 |
| 2023 | $6,941 | $70,022 | $10,195 | $59,827 |
| 2022 | $6,941 | $62,406 | $8,990 | $53,416 |
| 2021 | $6,612 | $57,971 | $8,351 | $49,620 |
| 2020 | $6,824 | $61,130 | $8,806 | $52,324 |
| 2019 | $7,039 | $58,750 | $8,463 | $50,287 |
| 2018 | $6,653 | $56,978 | $9,464 | $47,514 |
| 2017 | $6,795 | $55,459 | $9,212 | $46,247 |
| 2016 | $6,746 | $53,213 | $8,839 | $44,374 |
| 2015 | $6,412 | $49,699 | $8,255 | $41,444 |
| 2014 | $5,586 | $47,151 | $8,210 | $38,941 |
| 2012 | $6,462 | $47,379 | $8,250 | $39,129 |
Source: Public Records
Map
Nearby Homes
- 3707 Neubauer Cir
- 4103 Neubauer Cir Unit 402
- 1200 Neubauer Cir Unit 1306
- 2200 Neubauer Cir Unit 131
- 709 Neubauer Cir
- 1505 Neubauer Cir
- 77 Bridlepath Dr
- 40 U S 45
- 37430 N Us Highway 45
- 3087 Haven Ln
- 2424 E Thornwood Dr
- 19135 W Millburn Rd
- 200 S Beck Rd Unit 12
- 18863 W Wooddale Trail
- 2798 Spring Cir S
- 2792 Spring Cir S
- 2813 Spring Cir S
- 586 Harvard Ct
- 205 Lake Shore Dr
- 2103 Witchwood Ln
- 3509 Neubauer Cir Unit 25
- 3507 Neubauer Cir
- 3505 Neubauer Cir Unit 23
- 3503 Neubauer Cir Unit 22
- 3311 Redbud Dr Unit 11
- 3309 Redbud Dr Unit 12
- 3307 Redbud Dr Unit 13
- 3709 Neubauer Cir Unit 105
- 3707 Neubauer Cir Unit 104
- 3400 Neubauer Cir Unit 101
- 3305 Redbud Dr Unit 14
- 3010 Neubauer Cir Unit 116
- 3402 Neubauer Cir
- 3402 Neubauer Cir Unit 10-2
- 3404 Neubauer Cir
- 3008 Neubauer Cir Unit 115
- 3703 Neubauer Cir Unit 102
- 3406 Neubauer Cir Unit 10-4
- 3406 Neubauer Cir
- 3006 Neubauer Cir Unit 114