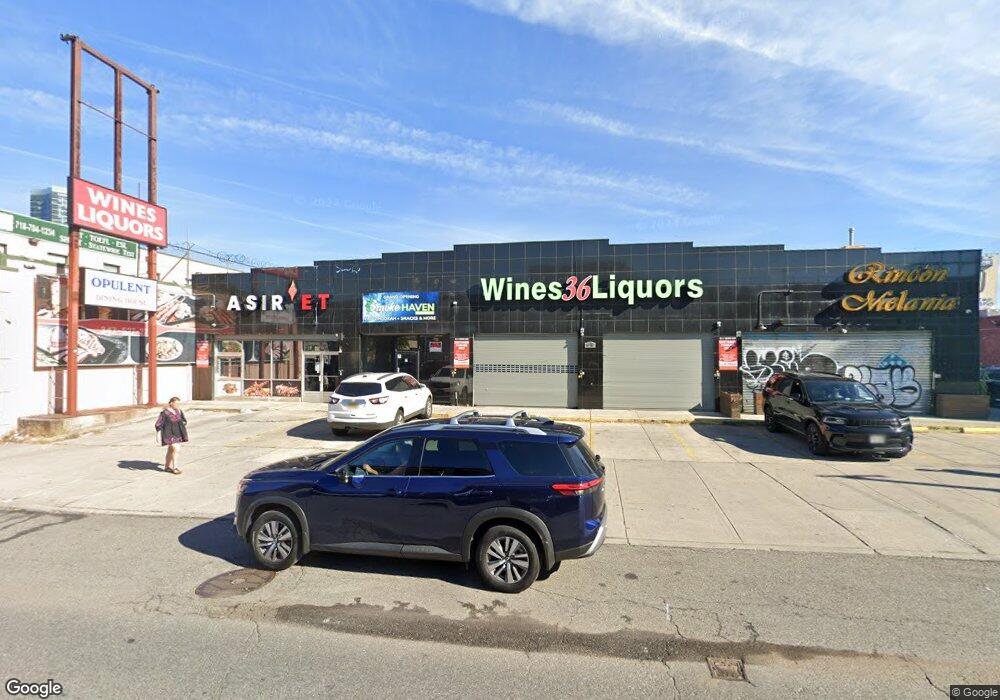
3511 Queens Blvd Unit C+D Long Island City, NY 11101
Long Island City NeighborhoodEstimated Value: $6,578,640
--
Bed
--
Bath
11,700
Sq Ft
$562/Sq Ft
Est. Value
About This Home
This home is located at 3511 Queens Blvd Unit C+D, Long Island City, NY 11101 and is currently estimated at $6,578,640, approximately $562 per square foot. 3511 Queens Blvd Unit C+D is a home located in Queens County with nearby schools including P.S. 150Q Sunnyside, Long Island City High School, and Most Precious Blood Roman Catholic Church.
Ownership History
Date
Name
Owned For
Owner Type
Purchase Details
Closed on
Sep 22, 2004
Sold by
Mashi Llc
Bought by
Rkc Management Realty Inc
Current Estimated Value
Home Financials for this Owner
Home Financials are based on the most recent Mortgage that was taken out on this home.
Original Mortgage
$2,300,000
Outstanding Balance
$1,136,431
Interest Rate
5.84%
Mortgage Type
Commercial
Estimated Equity
$5,442,209
Create a Home Valuation Report for This Property
The Home Valuation Report is an in-depth analysis detailing your home's value as well as a comparison with similar homes in the area
Home Values in the Area
Average Home Value in this Area
Purchase History
| Date | Buyer | Sale Price | Title Company |
|---|---|---|---|
| Rkc Management Realty Inc | $3,640,000 | -- |
Source: Public Records
Mortgage History
| Date | Status | Borrower | Loan Amount |
|---|---|---|---|
| Open | Rkc Management Realty Inc | $2,300,000 |
Source: Public Records
Tax History Compared to Growth
Tax History
| Year | Tax Paid | Tax Assessment Tax Assessment Total Assessment is a certain percentage of the fair market value that is determined by local assessors to be the total taxable value of land and additions on the property. | Land | Improvement |
|---|---|---|---|---|
| 2025 | $118,159 | $1,121,490 | $504,000 | $617,490 |
| 2024 | $118,159 | $1,115,550 | $504,000 | $611,550 |
| 2023 | $115,223 | $1,087,830 | $466,200 | $621,630 |
| 2022 | $114,150 | $1,110,150 | $504,000 | $606,150 |
| 2021 | $97,208 | $909,000 | $504,000 | $405,000 |
| 2020 | $107,983 | $1,168,200 | $504,000 | $664,200 |
| 2019 | $100,893 | $1,046,250 | $315,000 | $731,250 |
| 2018 | $93,712 | $891,306 | $264,600 | $626,706 |
| 2017 | $86,280 | $820,619 | $252,000 | $568,619 |
| 2016 | $82,433 | $820,619 | $252,000 | $568,619 |
| 2015 | $36,867 | $764,279 | $252,000 | $512,279 |
| 2014 | $36,867 | $747,449 | $246,600 | $500,849 |
Source: Public Records
Map
Nearby Homes
- 43-32 40th St
- 45-08 40th St Unit F44
- 45-08 40th St Unit F32
- 2594 40th St
- 4538 40th St
- 41-21 39th Place
- 41-13 39th Place Unit 3
- 41-15 39th Place Unit 1
- 41-15 39th Place Unit 3
- 45-32 41st St
- 48-12 37th St
- 0 39th St
- 41-02 Queens Blvd Unit 4E
- 41-02 Queens Blvd Unit 5-E
- 41-41 41st St Unit 1G
- 41-12 41st St Unit 3 H
- 41-12 41st St Unit 2J
- 47-25 40th St Unit 2C
- 41-42 42nd St Unit E4
- 4805 42nd St Unit 5G
- 3511 Queens Blvd Unit R
- 3511 Queens Blvd Unit B
- 3511 Queens Blvd
- 3511 Queens Blvd
- 3511 Queens Blvd
- 35-11 Queens Blvd Unit C+D
- 35-11 Queens Blvd Unit R
- 35-11 Queens Blvd Unit B
- 4338 36th St
- 3501 Queens Blvd
- 4331 35th St
- 4339 35th St
- 3601 Queens Blvd
- 3601 Queens Blvd
- 4331 36th St
- 4331 36th St
- 4327 36th St
- 4327 36th St Unit 1
- 4327 36th St
- 35-01 Queens Blvd