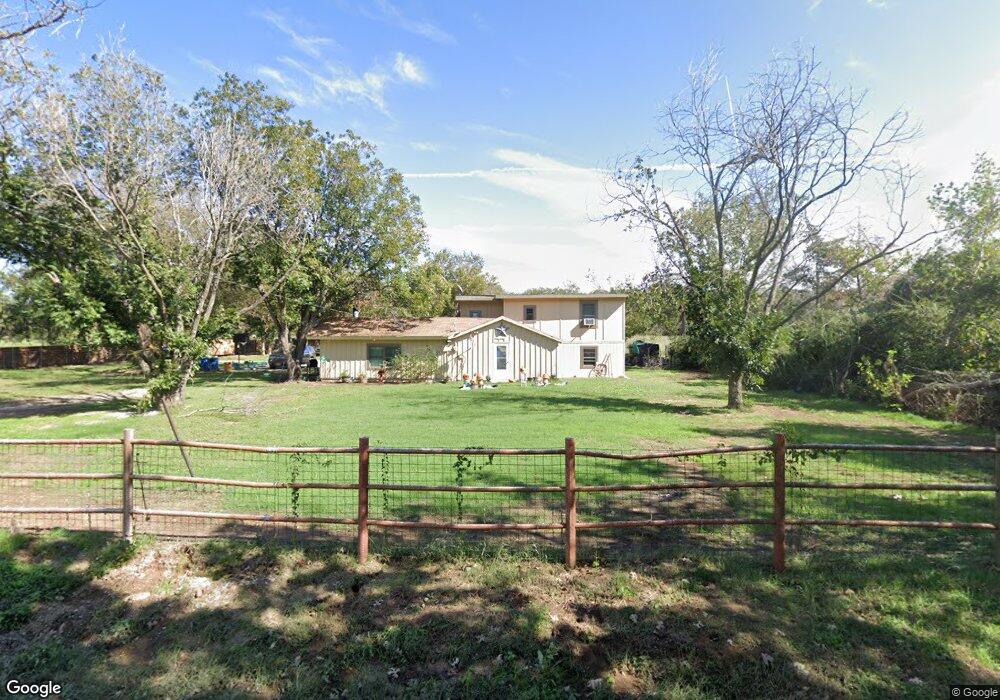
3511 Trails End Rd Burleson, TX 76028
Osage-North Fisk NeighborhoodEstimated Value: $367,000 - $479,000
3
Beds
2
Baths
2,235
Sq Ft
$189/Sq Ft
Est. Value
About This Home
This home is located at 3511 Trails End Rd, Burleson, TX 76028 and is currently estimated at $422,753, approximately $189 per square foot. 3511 Trails End Rd is a home located in Johnson County with nearby schools including Irene Clinkscale Elementary School, Burleson Centennial High School, and Joshua Adventist Multigrade School.
Ownership History
Date
Name
Owned For
Owner Type
Purchase Details
Closed on
Oct 30, 2019
Sold by
Adams John R and Adams Gloria A
Bought by
Kachel Donald L and Ransom Laura L
Current Estimated Value
Home Financials for this Owner
Home Financials are based on the most recent Mortgage that was taken out on this home.
Original Mortgage
$233,000
Outstanding Balance
$157,327
Interest Rate
3.7%
Mortgage Type
New Conventional
Estimated Equity
$265,426
Purchase Details
Closed on
Jul 26, 2006
Sold by
Ryan Michael and Ryan Marcie
Bought by
Adams John R and Adams Gloria A
Home Financials for this Owner
Home Financials are based on the most recent Mortgage that was taken out on this home.
Original Mortgage
$124,900
Interest Rate
6.78%
Mortgage Type
New Conventional
Create a Home Valuation Report for This Property
The Home Valuation Report is an in-depth analysis detailing your home's value as well as a comparison with similar homes in the area
Home Values in the Area
Average Home Value in this Area
Purchase History
| Date | Buyer | Sale Price | Title Company |
|---|---|---|---|
| Kachel Donald L | -- | None Available | |
| Adams John R | -- | None Available |
Source: Public Records
Mortgage History
| Date | Status | Borrower | Loan Amount |
|---|---|---|---|
| Open | Kachel Donald L | $233,000 | |
| Previous Owner | Adams John R | $124,900 |
Source: Public Records
Tax History Compared to Growth
Tax History
| Year | Tax Paid | Tax Assessment Tax Assessment Total Assessment is a certain percentage of the fair market value that is determined by local assessors to be the total taxable value of land and additions on the property. | Land | Improvement |
|---|---|---|---|---|
| 2025 | $1,781 | $190,120 | $142,000 | $48,120 |
| 2024 | $3,075 | $181,724 | $0 | $0 |
| 2023 | $1,522 | $190,120 | $142,000 | $48,120 |
| 2022 | $2,880 | $190,120 | $142,000 | $48,120 |
| 2021 | $2,696 | $175,920 | $127,800 | $48,120 |
| 2020 | $2,549 | $124,120 | $76,000 | $48,120 |
| 2019 | $2,733 | $124,120 | $76,000 | $48,120 |
| 2018 | $2,513 | $114,120 | $66,000 | $48,120 |
| 2017 | $2,210 | $114,120 | $66,000 | $48,120 |
| 2016 | $2,009 | $97,531 | $48,000 | $49,531 |
| 2015 | $1,554 | $97,531 | $48,000 | $49,531 |
| 2014 | $1,554 | $88,589 | $38,000 | $50,589 |
Source: Public Records
Map
Nearby Homes
- 3500 Trails End Rd
- 7791 Weatherby Rd
- 3924 Cross Timber Rd
- 316 Diamond Ln
- 2736 County Road 804a
- 3175 Collins Rd
- 3345 Collins Rd
- 3101 Collins Rd
- 1668 Cedar Elm Way
- 1660 Cedar Elm Way
- 1656 Cedar Elm Way
- 1652 Sequoia Way
- 1824 Fm 731
- 3225 Fm 731
- 1901 W Bethesda Rd
- 2832 Private Access Road 73107
- 2828 Private Access Road 73107
- 2805 Private Access Road 73107
- 7480 County Road 802
- 2010 Valley View Dr
- 3520 Trails End Rd
- 3570 Trails End Rd
- 3450 Trails End Rd
- 0000 Trails End Rd
- 3501 Trails End Rd
- 3641 Trails End Rd
- 3421 Trails End Rd
- 3611 Trails End Rd
- 3601 Trails End Rd
- 3410 Trails End 2 Acres Rd
- 3375 Trails End Rd
- 3301 Trails End Rd
- 3701 Trails End Rd
- 3275 Trails End Rd
- 3600 Trails End Rd
- 3651 Trails End Rd
- 3377 Trails End Rd
- 3201 Trails End Rd
- 4750 Trails End Rd
- 3385 Trails End Rd