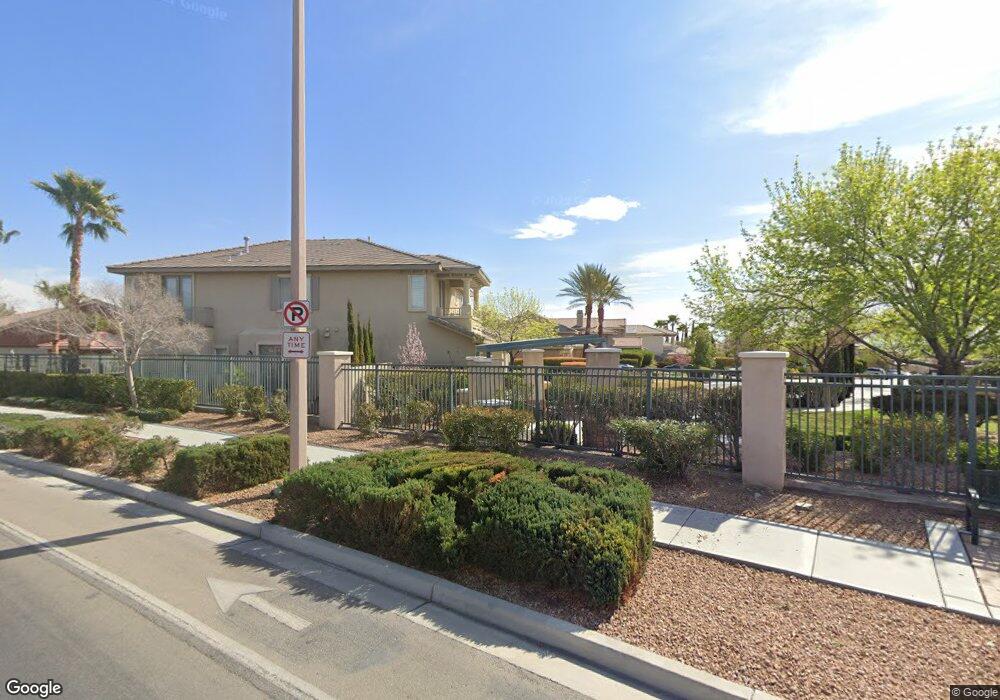
3512 Coventry Gardens Dr Unit 1 Las Vegas, NV 89135
South Summerlin NeighborhoodEstimated Value: $887,000 - $1,161,000
3
Beds
3
Baths
2,693
Sq Ft
$370/Sq Ft
Est. Value
About This Home
This home is located at 3512 Coventry Gardens Dr Unit 1, Las Vegas, NV 89135 and is currently estimated at $995,170, approximately $369 per square foot. 3512 Coventry Gardens Dr Unit 1 is a home located in Clark County with nearby schools including Judy & John L. Goolsby Elementary School, Victoria Fertitta Middle School, and Spring Valley High School.
Ownership History
Date
Name
Owned For
Owner Type
Purchase Details
Closed on
Sep 16, 2003
Sold by
Newman Tadako M
Bought by
Newman Tadako M and Bc Living Trust
Current Estimated Value
Home Financials for this Owner
Home Financials are based on the most recent Mortgage that was taken out on this home.
Original Mortgage
$300,000
Outstanding Balance
$116,460
Interest Rate
4%
Estimated Equity
$878,710
Purchase Details
Closed on
Jul 30, 2003
Sold by
Coleman Toll Lp
Bought by
Newman Tadako M
Home Financials for this Owner
Home Financials are based on the most recent Mortgage that was taken out on this home.
Original Mortgage
$300,000
Outstanding Balance
$116,460
Interest Rate
4%
Estimated Equity
$878,710
Create a Home Valuation Report for This Property
The Home Valuation Report is an in-depth analysis detailing your home's value as well as a comparison with similar homes in the area
Home Values in the Area
Average Home Value in this Area
Purchase History
| Date | Buyer | Sale Price | Title Company |
|---|---|---|---|
| Newman Tadako M | -- | -- | |
| Newman Tadako M | $556,000 | United Title Of Nevada |
Source: Public Records
Mortgage History
| Date | Status | Borrower | Loan Amount |
|---|---|---|---|
| Open | Newman Tadako M | $300,000 |
Source: Public Records
Tax History Compared to Growth
Tax History
| Year | Tax Paid | Tax Assessment Tax Assessment Total Assessment is a certain percentage of the fair market value that is determined by local assessors to be the total taxable value of land and additions on the property. | Land | Improvement |
|---|---|---|---|---|
| 2025 | $5,473 | $259,937 | $110,600 | $149,337 |
| 2024 | $5,068 | $259,937 | $110,600 | $149,337 |
| 2023 | $5,068 | $214,642 | $74,200 | $140,442 |
| 2022 | $4,693 | $183,541 | $55,300 | $128,241 |
| 2021 | $4,344 | $177,702 | $55,300 | $122,402 |
| 2020 | $4,031 | $175,400 | $53,900 | $121,500 |
| 2019 | $3,778 | $166,798 | $46,900 | $119,898 |
| 2018 | $3,605 | $155,100 | $39,900 | $115,200 |
| 2017 | $4,402 | $149,855 | $33,600 | $116,255 |
| 2016 | $3,373 | $147,573 | $26,250 | $121,323 |
| 2015 | $3,367 | $145,007 | $25,550 | $119,457 |
| 2014 | $3,269 | $124,807 | $20,300 | $104,507 |
Source: Public Records
Map
Nearby Homes
- 3535 Coventry Gardens Dr
- 3552 Coventry Gardens Dr
- 3618 Auckland Castle St
- 10341 Early Morning Ave
- 10267 Early Morning Ave
- 10457 Abbotsbury Dr
- 3612 Chelsea Gardens Dr Unit 2
- 10227 Sunset Gardens Dr
- 10557 Garden Light Dr Unit 2
- 3567 Fair Bluff St
- 10555 Garden Rose Dr
- 10591 Garden Rose Dr
- 10032 Fox Springs Dr
- 3761 Tohono Canyon St
- 10195 Queensbury Ave
- 9917 Aspen Knoll Ct
- 10059 Oak Creek Canyon Ave
- 10685 Refectory Ave
- 9993 Lemon Valley Ave
- 9905 Fox Springs Dr
- 3502 Coventry Gardens Dr
- 3522 Coventry Gardens Dr
- 10349 Evening Primrose Ave
- 10339 Evening Primrose Ave
- 3532 Coventry Gardens Dr
- 10329 Evening Primrose Ave
- 10324 Garden Glen Ln
- 3527 Coventry Gardens Dr
- 10353 Starthistle Ln
- 10319 Evening Primrose Ave
- 10314 Garden Glen Ln
- 3548 Auckland Castle St
- 3485 Hawksbeard Ct
- 3542 Coventry Gardens Dr
- 10357 Starthistle Ln
- 3543 Coventry Gardens Dr Unit 1
- 3558 Auckland Castle St
- 10304 Garden Glen Ln Unit 1
- 10299 Evening Primrose Ave
- 10341 Sweet Fennel Dr